# CONNECTION LOST dashboard error every 30 seconds
**URL:** https://discourse.nodered.org/t/connection-lost-dashboard-error-every-30-seconds/40009
**Category:** Dashboard
**Created:** [29 January 2021 18:30 UTC](https://discourse.nodered.org/t/connection-lost-dashboard-error-every-30-seconds/40009 "2021-01-29T18:30:46Z")
**Posts on this page:** 14
**Page:** 1
### Author:  [@wa9mvz](https://discourse.nodered.org/u/wa9mvz)
#### Post date: [29 January 2021 18:30 UTC](https://discourse.nodered.org/t/connection-lost-dashboard-error-every-30-seconds/40009/1 "2021-01-29T18:30:47Z")
Running Node-Red on a Pi 3B and Chromium browser.
I am receiving external serial data from a SERIAL IN node and doing some arithmetic on the payload. Everything works flawlessly according to the debug nodes in the flow and it works fine when I initially switch to the dashboard to view the results.
But almost exactly every 30 seconds the dashboard view flashes the error "CONNECTION LOST". Everything reconnects in a second or two and all is well until after another 30 seconds when the behavior repeats.
Can anyone help me fix this?
Fred
---
### Author:  [@vikozo](https://discourse.nodered.org/u/vikozo)
#### Post date: [29 January 2021 18:37 UTC](https://discourse.nodered.org/t/connection-lost-dashboard-error-every-30-seconds/40009/2 "2021-01-29T18:37:03Z")
have you some information in the Log file of the Raspian/Debian? Or what do show a top command?
---
### Author:  [@wa9mvz](https://discourse.nodered.org/u/wa9mvz)
#### Post date: [29 January 2021 18:42 UTC](https://discourse.nodered.org/t/connection-lost-dashboard-error-every-30-seconds/40009/3 "2021-01-29T18:42:49Z")
I'm sorry, but I don't know how to access that
---
### Author:  [@hotNipi](https://discourse.nodered.org/u/hotNipi)
#### Post date: [29 January 2021 18:50 UTC](https://discourse.nodered.org/t/connection-lost-dashboard-error-every-30-seconds/40009/4 "2021-01-29T18:50:24Z")
What are the things you are presenting on your dashboard? Make a screenshot ..
---
### Author:  [@vikozo](https://discourse.nodered.org/u/vikozo)
#### Post date: [29 January 2021 18:53 UTC](https://discourse.nodered.org/t/connection-lost-dashboard-error-every-30-seconds/40009/5 "2021-01-29T18:53:55Z")
command Line of your Pi ?
cd /var/log
tail syslog
maybe there is something wrong
or just enter top in the comandline maybe you see something when it lost conection
---
### Author:  [@wa9mvz](https://discourse.nodered.org/u/wa9mvz)
#### Post date: [29 January 2021 19:30 UTC](https://discourse.nodered.org/t/connection-lost-dashboard-error-every-30-seconds/40009/6 "2021-01-29T19:30:59Z")
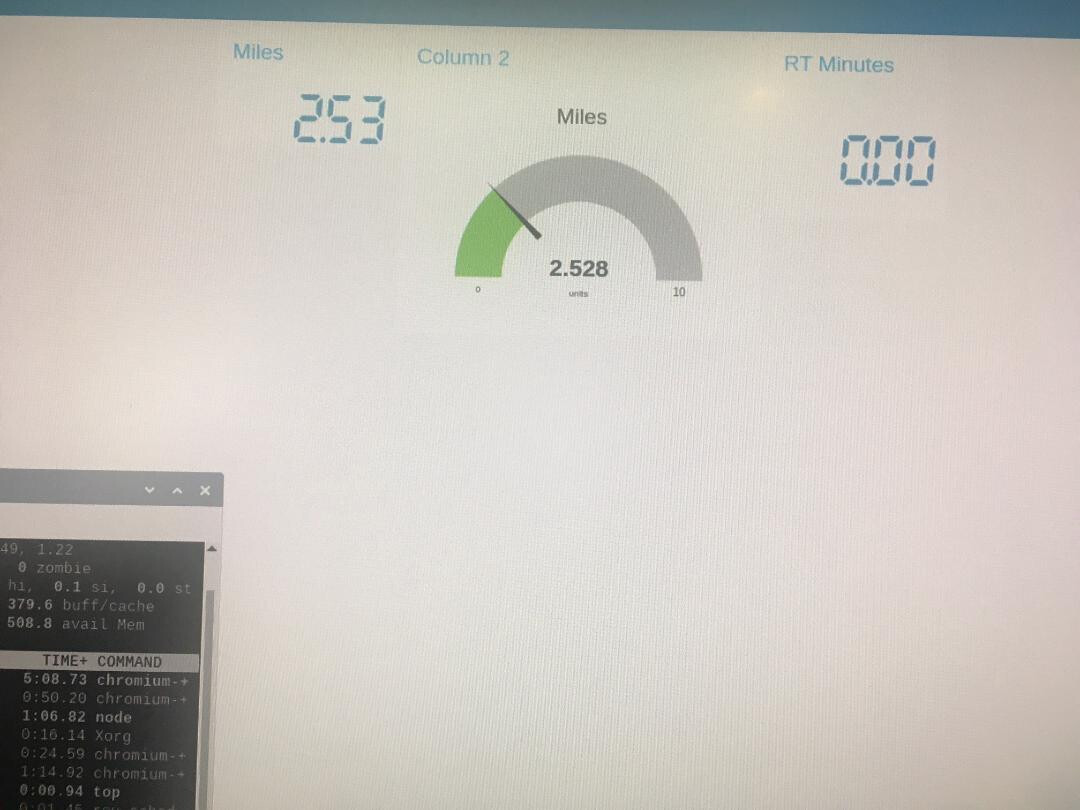

The dashboard is fairly simple. The serial data comes in fairly quickly (every 250mS or so) and as I said it appears to be working in the flow.
---
### Author:  [@hotNipi](https://discourse.nodered.org/u/hotNipi)
#### Post date: [29 January 2021 19:35 UTC](https://discourse.nodered.org/t/connection-lost-dashboard-error-every-30-seconds/40009/7 "2021-01-29T19:35:38Z")
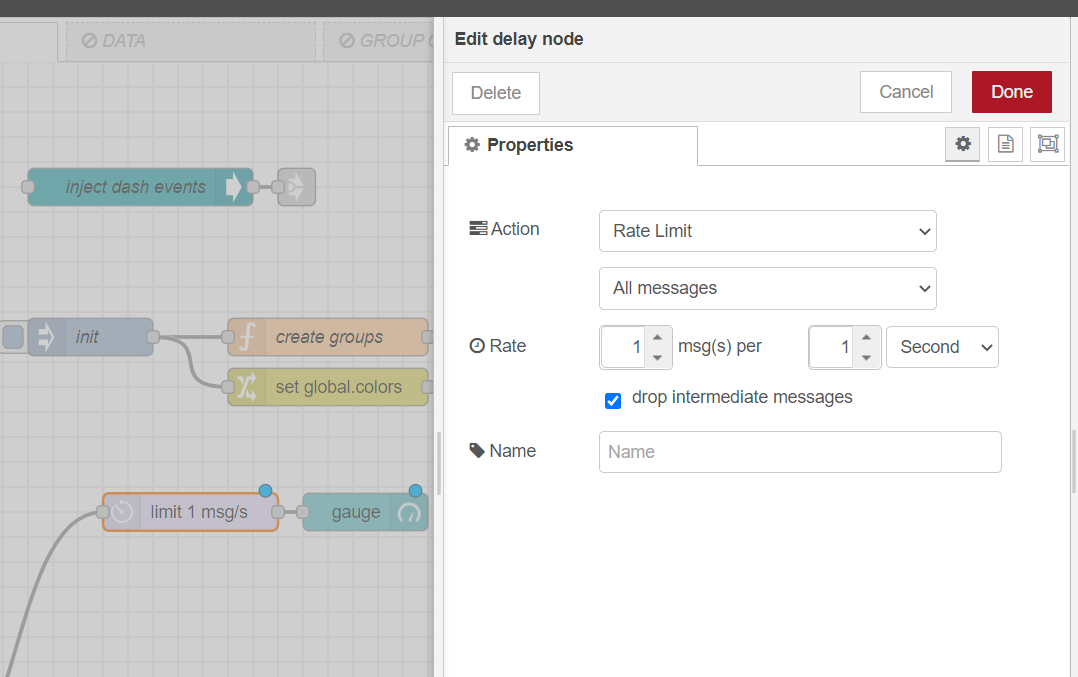
Try to limit the data rate on the flows before the nodes of dashboard widgets. See if that helps.
Use the delay node like this.
---
### Author:  [@wa9mvz](https://discourse.nodered.org/u/wa9mvz)
#### Post date: [29 January 2021 19:43 UTC](https://discourse.nodered.org/t/connection-lost-dashboard-error-every-30-seconds/40009/8 "2021-01-29T19:43:21Z")
I tried a delay in several locations. No joy.
---
### Author:  [@Paul-Reed](https://discourse.nodered.org/u/Paul-Reed)
#### Post date: [29 January 2021 20:06 UTC](https://discourse.nodered.org/t/connection-lost-dashboard-error-every-30-seconds/40009/9 "2021-01-29T20:06:15Z")
Try stopping node-RED - `node-red-stop` and restart again `node-red-start` and watch the log.
You will probably see the point where node-RED stops & restarts, so copy the log, and paste it here so we can see what's happening.
---
### Author:  [@wa9mvz](https://discourse.nodered.org/u/wa9mvz)
#### Post date: [29 January 2021 20:27 UTC](https://discourse.nodered.org/t/connection-lost-dashboard-error-every-30-seconds/40009/10 "2021-01-29T20:27:50Z")
Nothing pops up when the disconnect appears and the startup seems to be normal. I did notice that this only happens when I have the GAUGE in the group "COLUMN 2: active. Something about that is affecting this
```auto
29 Jan 14:19:29 - [info] Linux 4.19.118-v7+ arm LE
29 Jan 14:19:31 - [info] Loading palette nodes
29 Jan 14:19:37 - [info] Dashboard version 2.27.0 started at /ui
29 Jan 14:19:37 - [info] Settings file : /home/pi/.node-red/settings.js
29 Jan 14:19:37 - [info] Context store : 'default' [module=memory]
29 Jan 14:19:37 - [info] User directory : /home/pi/.node-red
29 Jan 14:19:37 - [warn] Projects disabled : editorTheme.projects.enabled=false
29 Jan 14:19:37 - [info] Flows file : /home/pi/.node-red/flows_raspberrypi.json
29 Jan 14:19:37 - [info] Server now running at http://127.0.0.1:1880/
29 Jan 14:19:37 - [warn]
---------------------------------------------------------------------
Your flow credentials file is encrypted using a system-generated key.
If the system-generated key is lost for any reason, your credentials
file will not be recoverable, you will have to delete it and re-enter
your credentials.
You should set your own key using the 'credentialSecret' option in
your settings file. Node-RED will then re-encrypt your credentials
file using your chosen key the next time you deploy a change.
---------------------------------------------------------------------
29 Jan 14:19:37 - [info] Starting flows
29 Jan 14:19:38 - [info] Started flows
29 Jan 14:19:38 - [info] serial port /dev/ttyAMA0 opened at 115200 baud 8N1
```
---
### Author:  [@wa9mvz](https://discourse.nodered.org/u/wa9mvz)
#### Post date: [29 January 2021 20:50 UTC](https://discourse.nodered.org/t/connection-lost-dashboard-error-every-30-seconds/40009/11 "2021-01-29T20:50:36Z")
There seems to be a speed limit to how fast the GAUGE node can update and I was apparently exceeding that limit. When I limit the number of decimals coming into GAUGE to 2 instead of 3, it updates more slowly and the CONNECTION crash goes away.
Thanks for the responses.
---
### Author:  [@hotNipi](https://discourse.nodered.org/u/hotNipi)
#### Post date: [29 January 2021 21:05 UTC](https://discourse.nodered.org/t/connection-lost-dashboard-error-every-30-seconds/40009/12 "2021-01-29T21:05:39Z")
Any widget with animations involved will make high rate updates very hard to handle. It is not possible to turn off the animations for `ui_gauge` node but you can use the [artless-gauge](https://flows.nodered.org/node/node-red-contrib-ui-artless-gauge) with animations turned off. But anyway, updating the gauge with high rate makes it pretty unreadable. So rate limit is reasonable thing to do.
---
### Author:  [@Colin](https://discourse.nodered.org/u/Colin)
#### Post date: [29 January 2021 21:10 UTC](https://discourse.nodered.org/t/connection-lost-dashboard-error-every-30-seconds/40009/13 "2021-01-29T21:10:06Z")
I imagine the main problem is running the browser on a pi3 with the node red dashboard and fairly rapid refresh rates. A pi 3 is barely powerful enough for that. You would have a much better experience if you upgraded to a pi 4.
---
### Author:  [@system](https://discourse.nodered.org/u/system)
#### Post date: [28 February 2021 21:11 UTC](https://discourse.nodered.org/t/connection-lost-dashboard-error-every-30-seconds/40009/14 "2021-02-28T21:11:02Z")
This topic was automatically closed 30 days after the last reply. New replies are no longer allowed.