# Custom solution for Dashboard chart settings - font, point colour, axis labels, etc
**URL:** https://discourse.nodered.org/t/custom-solution-for-dashboard-chart-settings-font-point-colour-axis-labels-etc/98961
**Category:** Share Your Projects
**Tags:** node-red-dashboard, chart, ui-template
**Created:** [5 September 2025 00:52 UTC](https://discourse.nodered.org/t/custom-solution-for-dashboard-chart-settings-font-point-colour-axis-labels-etc/98961 "2025-09-05T00:52:22Z")
**Posts on this page:** 7
**Page:** 1
### Author:  [@Lukario250](https://discourse.nodered.org/u/Lukario250)
#### Post date: [5 September 2025 00:52 UTC](https://discourse.nodered.org/t/custom-solution-for-dashboard-chart-settings-font-point-colour-axis-labels-etc/98961/1 "2025-09-05T00:52:22Z")
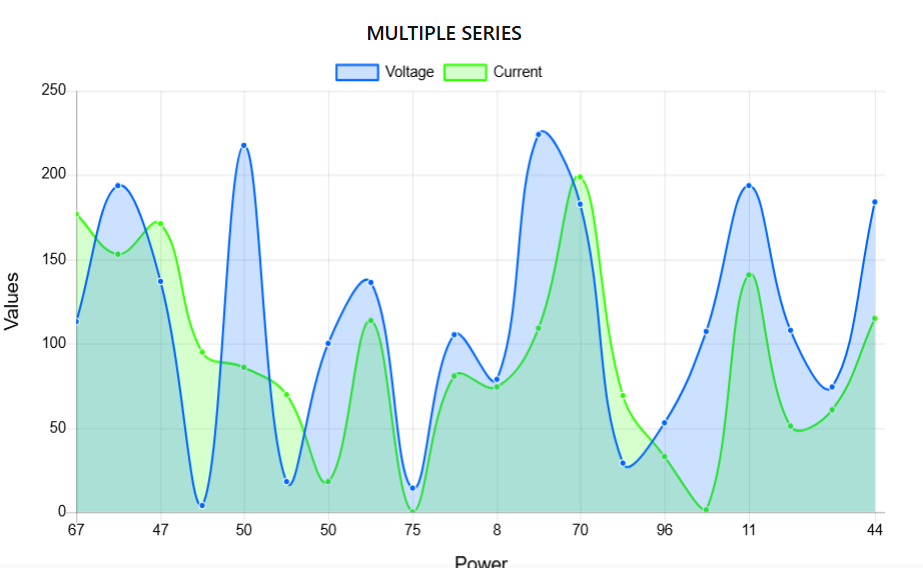
Hello there I’m currently working on an IoT project so I had the need to customize Node-RED charts so what I did was to use a function before the chart where I modify all the settings for the chart so I can visualize it better. I couldn’t really find a lot of easy info on it. So hopefully this will help some people save some time. Here is an example of what I could pull off, also the YouTube link where I explain what I did in detail with the GitHub repo.
Edit: I am using the “node-red-dashboard” library v 3.6.6 to get the charts.
[ ](https://www.youtube.com/watch?v=zoGizM_zNV8)
---
### Author:  [@discourse\_ai\_spam](https://discourse.nodered.org/u/discourse_ai_spam)
#### Post date: [5 September 2025 00:52 UTC](https://discourse.nodered.org/t/custom-solution-for-dashboard-chart-settings-font-point-colour-axis-labels-etc/98961/2 "2025-09-05T00:52:26Z")
---
### Author:  [@system](https://discourse.nodered.org/u/system)
#### Post date: [5 September 2025 06:52 UTC](https://discourse.nodered.org/t/custom-solution-for-dashboard-chart-settings-font-point-colour-axis-labels-etc/98961/3 "2025-09-05T06:52:57Z")
---
### Author:  [@E1cid](https://discourse.nodered.org/u/E1cid)
#### Post date: [5 September 2025 06:55 UTC](https://discourse.nodered.org/t/custom-solution-for-dashboard-chart-settings-font-point-colour-axis-labels-etc/98961/4 "2025-09-05T06:55:52Z")
Looks interesting for those who want to see the flow json here is the github page [IOT\_PROYECTS/NODE\_RED\_Customizable\_Graphs.json at main · balopez4/IOT\_PROYECTS · GitHub](https://github.com/balopez4/IOT_PROYECTS/blob/main/NODE_RED_Customizable_Graphs.json)
could you possibly uplooad to the flow library too:?
---
### Author:  [@zenofmud](https://discourse.nodered.org/u/zenofmud)
#### Post date: [5 September 2025 09:19 UTC](https://discourse.nodered.org/t/custom-solution-for-dashboard-chart-settings-font-point-colour-axis-labels-etc/98961/5 "2025-09-05T09:19:19Z")
I just want to add that this is an example for the original dashboard not dashboard-2
---
### Author:  [@TotallyInformation](https://discourse.nodered.org/u/TotallyInformation)
#### Post date: [5 September 2025 10:07 UTC](https://discourse.nodered.org/t/custom-solution-for-dashboard-chart-settings-font-point-colour-axis-labels-etc/98961/6 "2025-09-05T10:07:37Z")
Also noting that, for D2, there is an imminent migration from Chart.js to ECharts.
---
### Author:  [@AllanOricil](https://discourse.nodered.org/u/AllanOricil)
#### Post date: [6 September 2025 20:36 UTC](https://discourse.nodered.org/t/custom-solution-for-dashboard-chart-settings-font-point-colour-axis-labels-etc/98961/7 "2025-09-06T20:36:13Z")
Wild! You rock @Lukario250
What are your favorite pokemon?