# DB2 html-template chartjs

**URL:** <https://discourse.nodered.org/t/db2-html-template-chartjs/98712>\
**Category:** Dashboard\
**Tags:** dashboard-2\
**Created:** [18 August 2025 10:57 UTC](https://discourse.nodered.org/t/db2-html-template-chartjs/98712 "2025-08-18T10:57:20Z")\
**Posts on this page:** 17\
**Page:** 1

<div class="post-metadata">

**Author:** ![rewegit](https://sea2.discourse-cdn.com/flex026/user_avatar/discourse.nodered.org/rewegit/32/4778_2.png) [@rewegit](https://discourse.nodered.org/u/rewegit)\
**Post date:** [18 August 2025 10:57 UTC](https://discourse.nodered.org/t/db2-html-template-chartjs/98712/1 "2025-08-18T10:57:20Z")

</div>

DB2 html-template chartjs

I am desperately trying to use this example based on this minimal example (modified as a line graph):

[https://dashboard.flowfuse.com/nodes/widgets/ui-chart#building-custom-charts](https://dashboard.flowfuse.com/nodes/widgets/ui-chart#building-custom-charts)

With the help of the annotation plugin  
[https://www.chartjs.org/chartjs-plugin-annotation/latest/guide/integration.html](https://www.chartjs.org/chartjs-plugin-annotation/latest/guide/integration.html)

I just want to draw an annotation line. But no matter what I do, nothing is rendered.

What am I doing wrong? Or is the annotation plugin incompatible with DB2?

Here is my sample code:

```auto
<template>
    <canvas ref="chart" />
</template>

<script src="https://cdn.jsdelivr.net/npm/chart.js"></script>
<script src="https://cdn.jsdelivr.net/npm/chartjs-plugin-annotation"></script>

<script>
  export default {
        mounted() {
            // code here when the component is first loaded
            let interval = setInterval(() => {
                // wait until Chart and the annotation plugin are available globally
                if (window.Chart && (window.ChartAnnotation || window.chartjsPluginAnnotation)) {
                    clearInterval(interval);
                    // register plugin globally (cover different global names)
                    const plugin = window.ChartAnnotation || window.chartjsPluginAnnotation;
                    try {
                      // Chart.js tolerates multiple registrations, but check to be safe
                      if (!Chart.registry._plugins.list.includes(plugin)) {
                        Chart.register(plugin);
                      }
                    } catch(e){
                      // fallback: just register
                      Chart.register(plugin);
                    }
                    this.draw()
                }
            }, 100);
        },
        methods: {
            draw () {
                const ctx = this.$refs.chart
                new Chart(ctx, {
                    type: 'line',
                    data: {
                        labels: ['Red', 'Blue', 'Yellow', 'Green', 'Purple', 'Orange'],
                        datasets: [{
                            label: '# of Votes',
                            data: [12, 19, 3, 5, 2, 3],
                            borderWidth: 1,
                            borderColor: 'rgba(54,162,235,1)',
                            backgroundColor: 'rgba(54,162,235,0.2)',
                            fill: false
                        }]
                    },
                    options: {
                        plugins: {
                            // configure annotation plugin
                            annotation: {
                                annotations: {
                                    // simple horizontal line at y = 8
                                    yLine: {
                                        type: 'line',
                                        // yMin and yMax equal => horizontal line
                                        yMin: 8,
                                        yMax: 8,
                                        borderColor: 'red',
                                        borderWidth: 2,
                                        borderDash: [6,4],
                                        // label on the line
                                        label: {
                                            enabled: true,
                                            content: 'Schwellenwert 8',
                                            position: 'end',
                                            backgroundColor: 'rgba(0,0,0,0.7)',
                                            color: '#fff',
                                            font: {
                                                size: 12
                                            }
                                        }
                                    }
                                }
                            }
                        },
                        scales: {
                            y: {
                                beginAtZero: true
                            }
                        }
                    }
                });
            }
        }
    }
</script>

```

---

<div class="post-metadata">

**Author:** ![rakgupta](https://sea2.discourse-cdn.com/flex026/user_avatar/discourse.nodered.org/rakgupta/32/42535_2.png) [@rakgupta](https://discourse.nodered.org/u/rakgupta)\
**Post date:** [18 August 2025 12:48 UTC](https://discourse.nodered.org/t/db2-html-template-chartjs/98712/2 "2025-08-18T12:48:54Z")

</div>

I don’t use that particular plug-in but there is sample working code for chart.js in ui-template in this post. [Working code - Chart.js and ui-template](https://discourse.nodered.org/t/db2-migrating-chart-js-from-db1/98421/9).

Hope this helps.

---

<div class="post-metadata">

**Author:** ![rewegit](https://sea2.discourse-cdn.com/flex026/user_avatar/discourse.nodered.org/rewegit/32/4778_2.png) [@rewegit](https://discourse.nodered.org/u/rewegit)\
**Post date:** [18 August 2025 15:14 UTC](https://discourse.nodered.org/t/db2-html-template-chartjs/98712/3 "2025-08-18T15:14:26Z")

</div>

Thanks for your help  
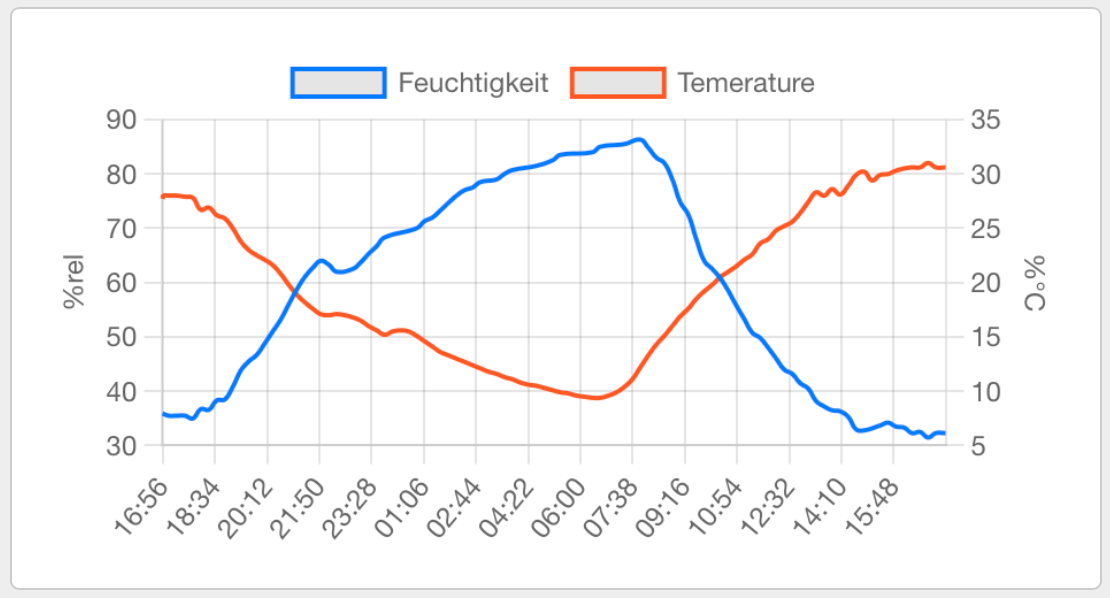
The problem is not the general creation of charts in the html template.  
My original template runs as a multi-axis line chart without any problems.
 ![2025-08-18_17-13-08](https://us1.discourse-cdn.com/flex026/uploads/nodered/original/3X/3/2/32b5581183c36fdc3b1667b0e30bef58901f1442.png)

I just can't get the annotation plugin to work.  
Neither in my original template nor in the minimal version.

---

<div class="post-metadata">

**Author:** ![Buckskin](https://avatars.discourse-cdn.com/v4/letter/b/b9e5f3/32.png) [@Buckskin](https://discourse.nodered.org/u/Buckskin)\
**Post date:** [18 August 2025 16:29 UTC](https://discourse.nodered.org/t/db2-html-template-chartjs/98712/4 "2025-08-18T16:29:21Z")

</div>

I do not think you need to register the plugin. According to the Annotation use page all that is required is the script source lines and then draw()

```auto
<script src="path/to/chartjs/dist/chart.min.js"></script>
<script src="path/to/chartjs-plugin-annotation/dist/chartjs-plugin-annotation.min.js"></script>
<script>
    var myChart = new Chart(ctx, {...});
</script>

```

The registration is only required for Bundlers.

---

<div class="post-metadata">

**Author:** ![Aaqu](https://sea2.discourse-cdn.com/flex026/user_avatar/discourse.nodered.org/aaqu/32/101407_2.png) [@Aaqu](https://discourse.nodered.org/u/Aaqu)\
**Post date:** [18 August 2025 16:37 UTC](https://discourse.nodered.org/t/db2-html-template-chartjs/98712/5 "2025-08-18T16:37:43Z")

</div>

I've been working on this for three hours. It seems like the annotation module doesn't work properly along with Vue dashboard.

---

<div class="post-metadata">

**Author:** ![rewegit](https://sea2.discourse-cdn.com/flex026/user_avatar/discourse.nodered.org/rewegit/32/4778_2.png) [@rewegit](https://discourse.nodered.org/u/rewegit)\
**Post date:** [18 August 2025 19:16 UTC](https://discourse.nodered.org/t/db2-html-template-chartjs/98712/6 "2025-08-18T19:16:05Z")

</div>

Oh, I'm sorry you invested so much time. I'm giving up for now too 😉

---

<div class="post-metadata">

**Author:** ![rewegit](https://sea2.discourse-cdn.com/flex026/user_avatar/discourse.nodered.org/rewegit/32/4778_2.png) [@rewegit](https://discourse.nodered.org/u/rewegit)\
**Post date:** [18 August 2025 19:19 UTC](https://discourse.nodered.org/t/db2-html-template-chartjs/98712/7 "2025-08-18T19:19:19Z")

</div>

I haven't been able to do that yet either. Is there an example somewhere of how to use it in the DB2 template node?

---

<div class="post-metadata">

**Author:** ![Buckskin](https://avatars.discourse-cdn.com/v4/letter/b/b9e5f3/32.png) [@Buckskin](https://discourse.nodered.org/u/Buckskin)\
**Post date:** [18 August 2025 19:26 UTC](https://discourse.nodered.org/t/db2-html-template-chartjs/98712/8 "2025-08-18T19:26:20Z")

</div>

This shows the graph and looking at the page info (Ctrl 12) I can see that the annotation file is loaded, but, like others so far no annotation line;

```auto
<template>
    <canvas ref="chart" />
</template>

<script src="https://cdn.jsdelivr.net/npm/chart.js"></script>
<script src="https://cdn.jsdelivr.net/npm/chartjs-plugin-annotation"></script>

<script>
    export default {
        data() {           
            return {
                isChartLoaded: false,
                chartTitle: '',
                             
            }
        },
        
        async mounted() {
            await this.$nextTick()

            this.draw()
 
            this.isChartLoaded = true
            this.send({loaded: this.isChartLoaded})

        },

        methods: {
            draw () {

```

---

<div class="post-metadata">

**Author:** ![rewegit](https://sea2.discourse-cdn.com/flex026/user_avatar/discourse.nodered.org/rewegit/32/4778_2.png) [@rewegit](https://discourse.nodered.org/u/rewegit)\
**Post date:** [18 August 2025 21:00 UTC](https://discourse.nodered.org/t/db2-html-template-chartjs/98712/9 "2025-08-18T21:00:06Z")

</div>

Yes, that's as far as I've got so far.  
Unfortunately, I'm not a web developer. 😓

---

<div class="post-metadata">

**Author:** ![bakman2](https://sea2.discourse-cdn.com/flex026/user_avatar/discourse.nodered.org/bakman2/32/6207_2.png) [@bakman2](https://discourse.nodered.org/u/bakman2)\
**Post date:** [19 August 2025 06:59 UTC](https://discourse.nodered.org/t/db2-html-template-chartjs/98712/10 "2025-08-19T06:59:18Z")

</div>

What kind of chart are you looking for ?

 ![image](https://us1.discourse-cdn.com/flex026/uploads/nodered/original/3X/9/2/92bb75e97a1ceb032796f89825ffa25fcbfe03eb.png)  
example using echarts instead:

```html
<template>
  <div id="chart" style="width: 100%; height: 400px;"></div>
</template>

<script src="https://cdn.jsdelivr.net/npm/echarts@6.0.0/dist/echarts.min.js"></script>

<script>
  export default {
  mounted() {
    setTimeout(() => {
      if (window.echarts) {
        // use DOM element ID - refs will not function properly. 
        const chartDom = document.getElementById('chart');
        if (!chartDom) {
          console.error('Chart container element not found');
          return;
        }

        this.chart = echarts.init(chartDom);

        const option = {
          title: { text: 'Votes' },
          tooltip: { trigger: 'axis' },
          legend: { show: false },
          xAxis: {
            type: 'category',
             data:['Red', 'Blue', 'Yellow', 'Green', 'Purple', 'Orange']
          },
          yAxis: {
            type: 'value'
          },
          series: [{
            name: '# of Votes',
            type: 'line',
             data:[12, 19, 3, 5, 2, 3],
            markLine: {
              data: [{ type: 'average', name: 'Avg' }],
              lineStyle: { color: 'red' }
            }
          }]
        };

        this.chart.setOption(option);
      } else {
        console.error('ECharts library not loaded yet');
      }
    }, 400); 
  }
};
</script>

<style>
  /* Optional styling */
</style>

```

Note the

> // use DOM element ID - refs will not function properly.

comment, i can imagine that the annotation plugin you are trying to use encounters the same reactivity issue.

---

<div class="post-metadata">

**Author:** ![Steve-Mcl](https://sea2.discourse-cdn.com/flex026/user_avatar/discourse.nodered.org/steve-mcl/32/4826_2.png) [@Steve-Mcl](https://discourse.nodered.org/u/Steve-Mcl)\
**Post date:** [19 August 2025 07:14 UTC](https://discourse.nodered.org/t/db2-html-template-chartjs/98712/11 "2025-08-19T07:14:36Z")

</div>

> [@bakman2](#):
>
> Note the
> 
> > // use DOM element ID - refs will not function properly.
> 
> comment

Curious as to why you say that? In my echarts example [here](https://discourse.nodered.org/t/how-to-configure-echarts-in-dashboard-2/87259/4), ref works fine.

---

<div class="post-metadata">

**Author:** ![bakman2](https://sea2.discourse-cdn.com/flex026/user_avatar/discourse.nodered.org/bakman2/32/6207_2.png) [@bakman2](https://discourse.nodered.org/u/bakman2)\
**Post date:** [19 August 2025 07:22 UTC](https://discourse.nodered.org/t/db2-html-template-chartjs/98712/12 "2025-08-19T07:22:09Z")

</div>

> [@Steve-Mcl](#):
>
> ref works fine.

Until it doesn't, certain properties are not working properly due to the way vue is handling proxied data. See [the notes](https://echarts.apache.org/en/faq.html#others) on echarts and [github](https://github.com/apache/echarts/issues/17723#issuecomment-1268311307). In general it will (seem to) work.

In this case for example, the tooltip will not work when it is set to `axis`, but will work when set to `item`.

---

<div class="post-metadata">

**Author:** ![Steve-Mcl](https://sea2.discourse-cdn.com/flex026/user_avatar/discourse.nodered.org/steve-mcl/32/4826_2.png) [@Steve-Mcl](https://discourse.nodered.org/u/Steve-Mcl)\
**Post date:** [19 August 2025 07:40 UTC](https://discourse.nodered.org/t/db2-html-template-chartjs/98712/13 "2025-08-19T07:40:37Z")

</div>

Ok, thanks for the link. My issue with instructing people to use an ID is that this becomes less reusable? I thought for a minute that you were saying it _must_ use an ID! I.e. that not using the ID is the problem where it appears the reason for being advised not to use ref is actually because a ref makes it a reactive proxy object.

A lot of words to say I would not promote the use of fixed ID. I wonder if wrapping it in a div with a ref then using regular dom call on the ref to get a non-reactive Dom object would be a better approach. e.g

```auto
const chart = this.$refs.wrapper.querySelector('.inner-element');

```

---

<div class="post-metadata">

**Author:** ![rewegit](https://sea2.discourse-cdn.com/flex026/user_avatar/discourse.nodered.org/rewegit/32/4778_2.png) [@rewegit](https://discourse.nodered.org/u/rewegit)\
**Post date:** [19 August 2025 07:53 UTC](https://discourse.nodered.org/t/db2-html-template-chartjs/98712/14 "2025-08-19T07:53:56Z")

</div>

That looks fantastic. Thank you very much. eCharts seems to be a real alternative. It's time to take a closer look at it.

---

<div class="post-metadata">

**Author:** ![bakman2](https://sea2.discourse-cdn.com/flex026/user_avatar/discourse.nodered.org/bakman2/32/6207_2.png) [@bakman2](https://discourse.nodered.org/u/bakman2)\
**Post date:** [19 August 2025 07:56 UTC](https://discourse.nodered.org/t/db2-html-template-chartjs/98712/15 "2025-08-19T07:56:55Z")

</div>

I am not sure if this would work, vue has a method to accomodate for this behaviour, where you can [exclude properties from becoming reactive](https://vuejs.org/api/reactivity-advanced.html#markraw), but I don't fully grasp what it would imply when used.

> that you were saying it _must_ use an ID!

It is more that you can expose the chart as an object that is not reactive, it can then still be updated from vue.

---

<div class="post-metadata">

**Author:** ![rewegit](https://sea2.discourse-cdn.com/flex026/user_avatar/discourse.nodered.org/rewegit/32/4778_2.png) [@rewegit](https://discourse.nodered.org/u/rewegit)\
**Post date:** [19 August 2025 10:04 UTC](https://discourse.nodered.org/t/db2-html-template-chartjs/98712/16 "2025-08-19T10:04:21Z")

</div>

A quick conversion. It's quite simple and does exactly what it should. Now some proper styling, then it's just as it should be.

Thanks again for the tip

 ![2025-08-19_11-59-35](https://us1.discourse-cdn.com/flex026/uploads/nodered/original/3X/5/1/51a01e9e464194f9763d1884cfdbf92259f604db.png)

---

<div class="post-metadata">

**Author:** ![system](https://us1.discourse-cdn.com/flex026/uploads/nodered/original/1X/d073cd938eafa2e558d7c2cd59003b3ef4963033.png) [@system](https://discourse.nodered.org/u/system)\
**Post date:** [18 September 2025 10:04 UTC](https://discourse.nodered.org/t/db2-html-template-chartjs/98712/17 "2025-09-18T10:04:57Z")

</div>

This topic was automatically closed 30 days after the last reply. New replies are no longer allowed.
