# Horizontal Bar Graph
**URL:** https://discourse.nodered.org/t/horizontal-bar-graph/98000
**Category:** Dashboard
**Tags:** node-red-dashboard, uibuilder, web-components
**Created:** [7 July 2025 03:11 UTC](https://discourse.nodered.org/t/horizontal-bar-graph/98000 "2025-07-07T03:11:58Z")
**Posts on this page:** 7
**Page:** 1
### Author:  [@donsay](https://discourse.nodered.org/u/donsay)
#### Post date: [7 July 2025 03:11 UTC](https://discourse.nodered.org/t/horizontal-bar-graph/98000/1 "2025-07-07T03:11:58Z")
I saw a few posts about horizontal bar graphs, and read about Plotly. I'd prefer to avoid an external dependency if I can.
The dashboard Chart node supports a horizontal bar graph, but it lacks two things I'm looking for:
- overlaying text on the bar
- a different scale than the bar min and max values
I have data that varies between -140 and -40. I'd like to plot that. When I plot a negative range like that, the Bar extends from right to left. It's easy enough to convert the value to a positive number, but I'd still like to display the scale from -140 to -40.
Am I overlooking something here? I know a little about html, and have used the UI template for a few really simple displays, just for formatted text.
rpi 3b+, NR ver 4.0.5
Thanks,
Don
---
### Author:  [@TotallyInformation](https://discourse.nodered.org/u/TotallyInformation)
#### Post date: [7 July 2025 09:48 UTC](https://discourse.nodered.org/t/horizontal-bar-graph/98000/2 "2025-07-07T09:48:15Z")
Not a Dashboard component - though it should be usable with either D1 or D2, I have an LED gauge web component if that helps. Though it does not currently allow separate setting of the LED values, I don't think it would be that hard to do, I'd be happy to try if you find the component otherwise useful.
[https://wc.totallyinformation.net/tests/live/led-gauge](https://wc.totallyinformation.net/tests/live/led-gauge)
---
### Author:  [@donsay](https://discourse.nodered.org/u/donsay)
#### Post date: [8 July 2025 05:01 UTC](https://discourse.nodered.org/t/horizontal-bar-graph/98000/3 "2025-07-08T05:01:53Z")
Thanks for the reply. I'll take a look.
---
### Author:  [@system](https://discourse.nodered.org/u/system)
#### Post date: [7 August 2025 05:02 UTC](https://discourse.nodered.org/t/horizontal-bar-graph/98000/4 "2025-08-07T05:02:50Z")
This topic was automatically closed 30 days after the last reply. New replies are no longer allowed.
---
### Author:  [@TotallyInformation](https://discourse.nodered.org/u/TotallyInformation)
#### Post date: [21 September 2025 10:31 UTC](https://discourse.nodered.org/t/horizontal-bar-graph/98000/5 "2025-09-21T10:31:20Z")
---
### Author:  [@TotallyInformation](https://discourse.nodered.org/u/TotallyInformation)
#### Post date: [21 September 2025 10:34 UTC](https://discourse.nodered.org/t/horizontal-bar-graph/98000/6 "2025-09-21T10:34:19Z")
> [@donsay](#):
>
> I'll take a look.
In case you are still interested, you should note that all of the settings are, in fact, controllable both from node-red and from front-end JavaScript.
For example, this inject node will change the max of the gauge:

`max`, `min`, `unit`, `value`, number of `segments` and `hide-segment-labels` are all controllable in addition to classes and styles.
LED segment colours can also be changed:
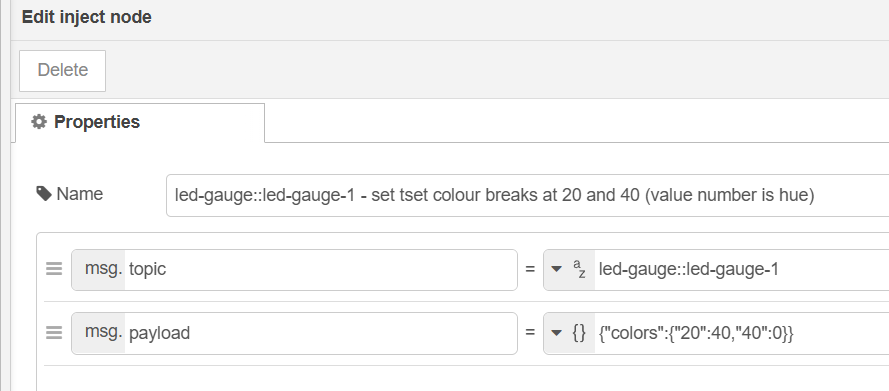
You can even change the label text:


Also, clicking on a segment returns data to Node-RED.
---
### Author:  [@TotallyInformation](https://discourse.nodered.org/u/TotallyInformation)
#### Post date: [21 September 2025 17:15 UTC](https://discourse.nodered.org/t/horizontal-bar-graph/98000/7 "2025-09-21T17:15:12Z")
Just for fun, here is a representation of wind speeds using colours based n the beaufort scale of danger.
The Beaufort scale runs from 0-12. 12 is 73+mph, I've capped the gauge at 100mph though the highest recorded wind speed is around 250mph.

```flows
[{"id":"6d51534aa8d488cf","type":"inject","z":"2c47031326e8fd01","g":"0958c88d9e5ba8df","name":"led-gauge::led-gauge-1 - Change to wind-speed with beaufort scale colors","props":[{"p":"topic","vt":"str"},{"p":"payload"}],"repeat":"","crontab":"","once":false,"onceDelay":0.1,"topic":"led-gauge::led-gauge-1","payload":"{\"innerText\":\"Wind Speed (Beaufort Scale, Max. 100 mph)\",\"min\":0,\"max\":100,\"colors\":{\"1\":150,\"3\":160,\"7\":170,\"12\":190,\"18\":210,\"24\":220,\"31\":50,\"38\":40,\"46\":30,\"54\":15,\"63\":0,\"72\":350,\"100\":330,\"250\":320},\"unit\":\"mph\"}","payloadType":"json","x":360,"y":840,"wires":[["e2b716427578f873"]]},{"id":"6ed93d4d08ba0502","type":"inject","z":"2c47031326e8fd01","g":"0958c88d9e5ba8df","name":"led-gauge::led-gauge-1 - set to random wind speed (0-250)","props":[{"p":"topic","vt":"str"},{"p":"payload"}],"repeat":"","crontab":"","once":false,"onceDelay":0.1,"topic":"led-gauge::led-gauge-1","payload":"{\t \"value\": $floor($random() * 250)\t}","payloadType":"jsonata","x":310,"y":880,"wires":[["135c2057a2bdc76b"]]}]
```