# How to set the x axis of chart as numeric value?
**URL:** https://discourse.nodered.org/t/how-to-set-the-x-axis-of-chart-as-numeric-value/98438
**Category:** Dashboard
**Tags:** chart
**Created:** [1 August 2025 09:12 UTC](https://discourse.nodered.org/t/how-to-set-the-x-axis-of-chart-as-numeric-value/98438 "2025-08-01T09:12:53Z")
**Posts on this page:** 4
**Page:** 1
### Author:  [@Kang](https://discourse.nodered.org/u/Kang)
#### Post date: [1 August 2025 09:12 UTC](https://discourse.nodered.org/t/how-to-set-the-x-axis-of-chart-as-numeric-value/98438/1 "2025-08-01T09:12:53Z")
Hi, sir
I found the chart node’s X axis is using string type label to display, which will bring two problems below, how can I fix them?
1. The X axis value is sorted by the X array index, not by the X array value itself. Like below:


1. The duplicated X/Y value will not overlap at one point like what we usually do in excel chart, how can I achieve this similar feature like excel chart using chart node?

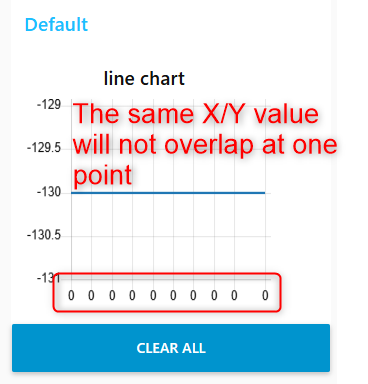
1. And how can I set the format of X and Y axis, like the major and minor units, label position, XY axis crosses point,etc like what we do in excel chart?
---
### Author:  [@jbudd](https://discourse.nodered.org/u/jbudd)
#### Post date: [1 August 2025 11:29 UTC](https://discourse.nodered.org/t/how-to-set-the-x-axis-of-chart-as-numeric-value/98438/2 "2025-08-01T11:29:16Z")
You are more likely to get a helpful reply if instead of a picture of your data, you post some of your actual data.
Maybe 10 data points seems about right.
I believe you are using the original node-red-dashboard.
If I remember correctly, it is only possible with a "stored data" type chart, where you post a batch of x,y coordinates all at once.
---
### Author:  [@Kang](https://discourse.nodered.org/u/Kang)
#### Post date: [1 August 2025 11:33 UTC](https://discourse.nodered.org/t/how-to-set-the-x-axis-of-chart-as-numeric-value/98438/3 "2025-08-01T11:33:01Z")
Hi, jbudd
If I understand correct, the "stored data" type chart with XY coordinate feature is not available in original node-red-dashboard?
I have to use dashboard2 to have this feature?
---
### Author:  [@system](https://discourse.nodered.org/u/system)
#### Post date: [31 August 2025 11:33 UTC](https://discourse.nodered.org/t/how-to-set-the-x-axis-of-chart-as-numeric-value/98438/4 "2025-08-31T11:33:42Z")
This topic was automatically closed 30 days after the last reply. New replies are no longer allowed.