# InfluxDB v2, how to combine multiple queries to show in one graph
**URL:** https://discourse.nodered.org/t/influxdb-v2-how-to-combine-multiple-queries-to-show-in-one-graph/95778
**Category:** General
**Tags:** influxdb
**Created:** [4 March 2025 08:15 UTC](https://discourse.nodered.org/t/influxdb-v2-how-to-combine-multiple-queries-to-show-in-one-graph/95778 "2025-03-04T08:15:11Z")
**Posts on this page:** 8
**Page:** 1
### Author:  [@cameo69](https://discourse.nodered.org/u/cameo69)
#### Post date: [4 March 2025 08:15 UTC](https://discourse.nodered.org/t/influxdb-v2-how-to-combine-multiple-queries-to-show-in-one-graph/95778/1 "2025-03-04T08:15:11Z")
Hi,
could I get some help with InfluxDB Queries for V2?
I used to use Influx v1.8 and am now trying to migrate to v2, but retrieving multiple time series in one go, like I did before, does not work right now.
Retrieving for example average temperatures of the last 30hours works for me like this:

```auto
[{"id":"83c863c322ea5dda","type":"inject","z":"da97d878.d3d728","name":"5m","props":[{"p":"payload"},{"p":"topic","vt":"str"}],"repeat":"300","crontab":"","once":true,"onceDelay":"3","topic":"","payload":"","payloadType":"date","x":450,"y":2580,"wires":[["b49dbc4c32f0921c"]]},{"id":"8fe384390823b16b","type":"ui_chart","z":"da97d878.d3d728","name":"","group":"f72a94e6.10d108","order":2,"width":0,"height":0,"label":"Temperatur (30h glatt 5m)","chartType":"line","legend":"false","xformat":"HH:mm:ss","interpolate":"linear","nodata":"No data","dot":false,"ymin":"","ymax":"","removeOlder":"30","removeOlderPoints":"","removeOlderUnit":"3600","cutout":0,"useOneColor":false,"useUTC":false,"colors":["#1f77b4","#aec7e8","#ff7f0e","#2ca02c","#98df8a","#d62728","#ff9896","#9467bd","#c5b0d5"],"outputs":1,"useDifferentColor":false,"className":"","x":1050,"y":2580,"wires":[[]]},{"id":"b49dbc4c32f0921c","type":"influxdb in","z":"da97d878.d3d728","influxdb":"1f7575cc.59429a","name":"Temp","query":"import \"math\"\n\nfrom(bucket:\"sensordb\")\n |> range(start: -30h)\n |> filter(fn: (r) => \n r._measurement == \"BME280\" and \n r._field == \"temp\")\n |> aggregateWindow(every: 5m, fn: mean, createEmpty: false)\n |> map(fn: (r) => ({ r with _value: math.round(x: r._value) }))\n\n","rawOutput":true,"precision":"","retentionPolicy":"","org":"dibu","x":610,"y":2580,"wires":[["41b4cbe9e4c8727d","289b45c59df30246"]]},{"id":"41b4cbe9e4c8727d","type":"change","z":"da97d878.d3d728","name":"prep chart v05","rules":[{"t":"set","p":"payload","pt":"msg","to":"[\t {\t \"series\": [$.payload[0]._field],\t \"labels\": [\"\"],\t \"data\": [\t $[].[\t $.payload.(\t $._value != null ? {\"x\": $toMillis(_time),\"y\": _value}\t )\t]\t ]\t}\t]\t","tot":"jsonata"}],"action":"","property":"","from":"","to":"","reg":false,"x":800,"y":2580,"wires":[["8fe384390823b16b","17378eab49b3eb17"]]},{"id":"289b45c59df30246","type":"debug","z":"da97d878.d3d728","name":"","active":true,"tosidebar":true,"console":false,"tostatus":false,"complete":"false","statusVal":"","statusType":"auto","x":790,"y":2620,"wires":[]},{"id":"17378eab49b3eb17","type":"debug","z":"da97d878.d3d728","name":"","active":true,"tosidebar":true,"console":false,"tostatus":false,"complete":"false","statusVal":"","statusType":"auto","x":1010,"y":2620,"wires":[]},{"id":"f72a94e6.10d108","type":"ui_group","name":"Temperatur","tab":"567fd079.3e213","order":1,"disp":true,"width":"6","collapse":false},{"id":"1f7575cc.59429a","type":"influxdb","hostname":"influxdb","port":"8086","protocol":"http","database":"sensordb","name":"","usetls":false,"tls":"","influxdbVersion":"2.0","url":"http://influxdb2:8086","timeout":"","rejectUnauthorized":false},{"id":"567fd079.3e213","type":"ui_tab","name":"Sensoren","icon":"dashboard","order":1,"disabled":false,"hidden":false}]
```
The query from the example that works is:
```auto
import "math"
from(bucket:"sensordb")
|> range(start: -30h)
|> filter(fn: (r) =>
r._measurement == "BME280" and
r._field == "temp")
|> aggregateWindow(every: 5m, fn: mean, createEmpty: false)
|> map(fn: (r) => ({ r with _value: math.round(x: r._value) }))
```
and the output is something like this (removed elements from the array):

```auto
[
{
"result": "_result",
"table": 0,
"_field": "temp",
"_measurement": "BME280",
"_start": "2025-03-04T06:37:20.859943864Z",
"_stop": "2025-03-04T07:37:20.859943864Z",
"_time": "2025-03-04T06:40:00Z",
"_value": 23
},
{
"result": "_result",
"table": 0,
"_field": "temp",
"_measurement": "BME280",
"_start": "2025-03-04T06:37:20.859943864Z",
"_stop": "2025-03-04T07:37:20.859943864Z",
"_time": "2025-03-04T06:45:00Z",
"_value": 24
}
]
```
The conversion for the graph to show that is done by JSONATA:
```auto
[
{
"series": [$.payload[0]._field],
"labels": [""],
"data": [
$[].[
$.payload.(
$._value != null ? {"x": $toMillis(_time),"y": _value}
)
]
]
}
]
```
and results in something like this:

```auto
[
{
"series": [
"temp"
],
"labels": [
""
],
"data": [
[
{
"x": 1741070400000,
"y": 23
},
{
"x": 1741070700000,
"y": 24
}
]
}
]
```
Let's assume I have multiple such time series of temperature and would like to show them in one graph.
With InfluxDB v1 I would simply concatenate the queries (which looked more like SQL):
```auto
SELECT round(mean("temp")*100)/100 AS "BME280" FROM "example" WHERE sensor = 'BME280' AND time > now() - 30h GROUP BY time(5m) FILL(null);
SELECT round(mean("temp")*100)/100 AS "BME280_2" FROM "example" WHERE sensor = 'BME280_2' AND time > now() - 30h GROUP BY time(5m) FILL(null);
```
The result is an object with attribute `results` and `results` is an array with as much elements as there are queries:

Those I would re-arrange with JSONATA and show them all together in a chart:

However, with InfluxDB v2 I cannot find a way to combine multiple queries.
Also the time series do not have an equal time (some get data every 5sec and others only get data every minute or so), hence a simple join seems not to work.
Probably, I could create some flow with multiple single queries, collect them in a buffer and once all queries finished, combine all into one message, but that seems neither very efficient nor elegant.
Maybe one of you has a better idea or knows how to combine queries?
Versions
NodeRed v4.0.9
InfluxDB v2.7.11
---
### Author:  [@Colin](https://discourse.nodered.org/u/Colin)
#### Post date: [4 March 2025 10:13 UTC](https://discourse.nodered.org/t/influxdb-v2-how-to-combine-multiple-queries-to-show-in-one-graph/95778/2 "2025-03-04T10:13:15Z")
This may be too late, but personally I made a decision to stick with v1 until v3 is released, as it seems they are ditching Flux and reverting to something more sensible, and I don't want to have to migrate twice.
As for querying multiple buckets with Flux, Google has not been particularly helpful.
> [@cameo69](#):
>
> I could create some flow with multiple single queries, collect them in a buffer and once all queries finished, combine all into one message,
That may well be the way to go.
---
### Author:  [@cameo69](https://discourse.nodered.org/u/cameo69)
#### Post date: [7 March 2025 21:44 UTC](https://discourse.nodered.org/t/influxdb-v2-how-to-combine-multiple-queries-to-show-in-one-graph/95778/3 "2025-03-07T21:44:06Z")
I am still in experimentation phase, could go back, but since there was no better idea here, I clicked together some working solution. It is not very complicated, so probably I will go with v2.x albeit you were right, seems an alpha version of InfluxDB v3 is available.
Wanted to quickly share the solution for reference if somebody needs it in the future 🙂
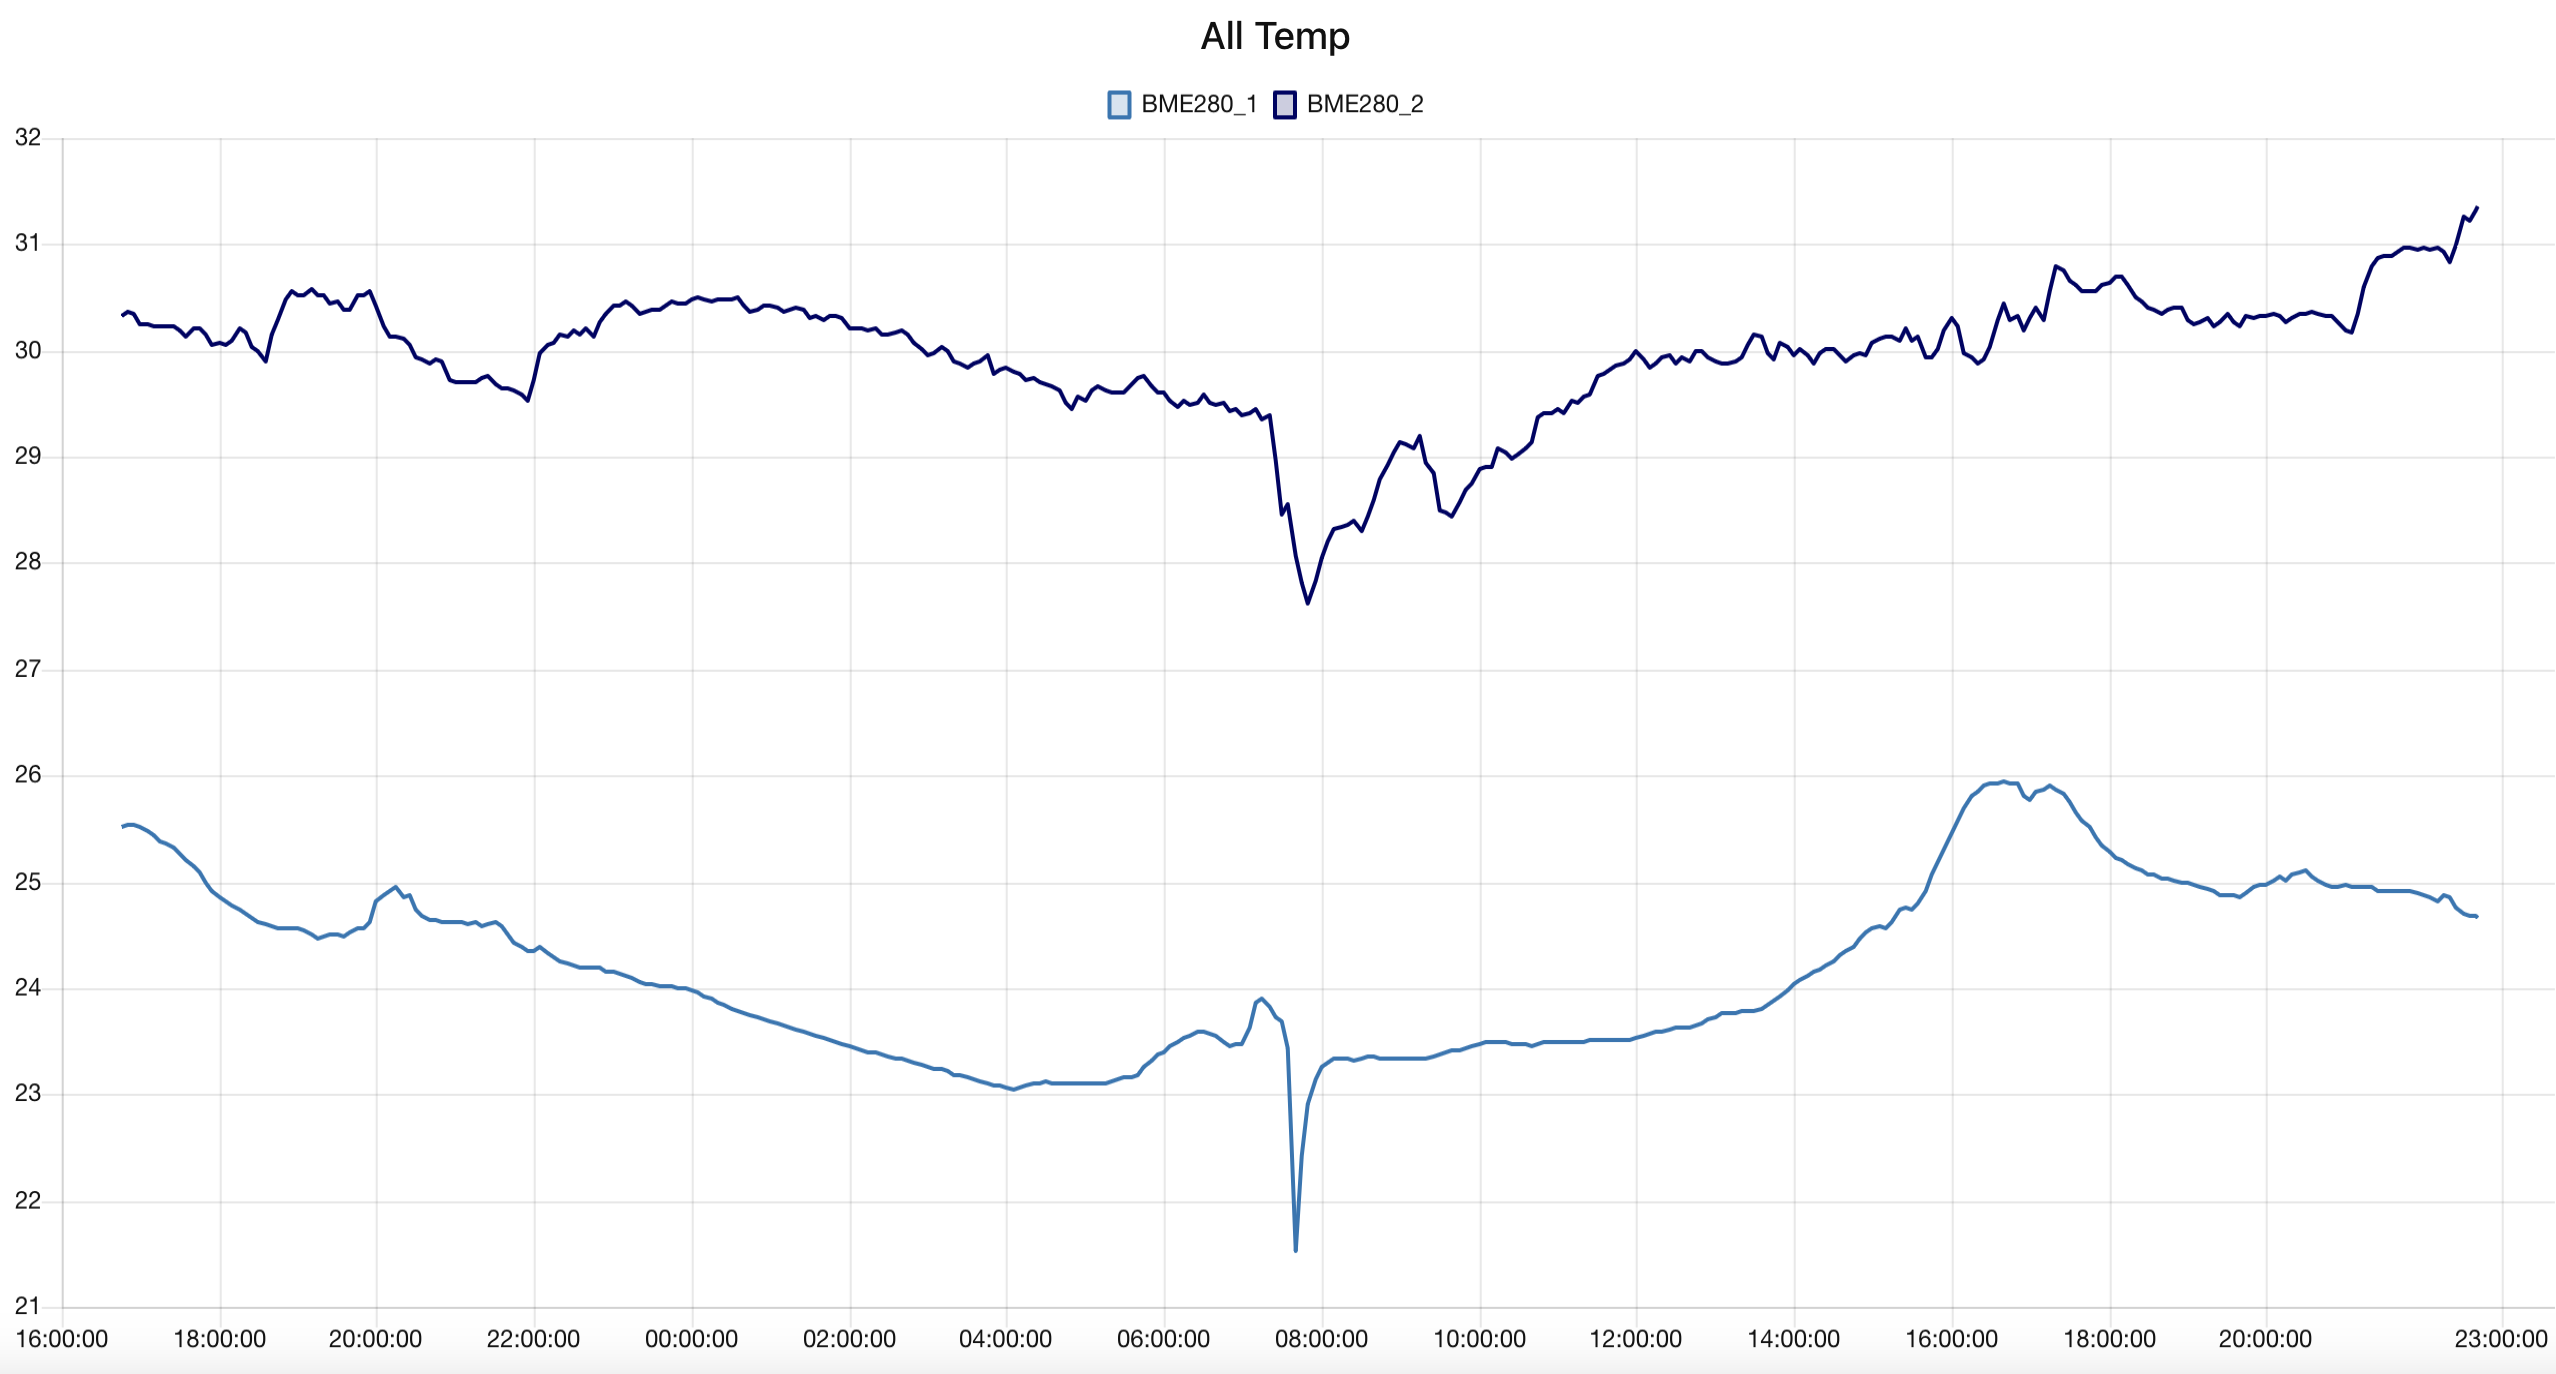
The flow can be easily extended for more timelines, in this example I use only 2.

```auto
[{"id":"5c2d2c9ac70d09b7","type":"inject","z":"da97d878.d3d728","name":"5m","props":[{"p":"payload"},{"p":"topic","vt":"str"}],"repeat":"300","crontab":"","once":true,"onceDelay":"3","topic":"","payload":"","payloadType":"date","x":270,"y":3100,"wires":[["321c226b49288336","b78dca6feeef20c5"]]},{"id":"7c2fe234d4b7eab1","type":"ui_chart","z":"da97d878.d3d728","name":"","group":"7f797fc9f4a11277","order":1,"width":0,"height":0,"label":"All Temp","chartType":"line","legend":"true","xformat":"HH:mm:ss","interpolate":"linear","nodata":"No data","dot":false,"ymin":"","ymax":"","removeOlder":"30","removeOlderPoints":"","removeOlderUnit":"3600","cutout":0,"useOneColor":false,"useUTC":false,"colors":["#1f77b4","#000366","#f70285","#ec8d09","#f5450a","#2aa02b","#7d0ced","#9846fb","#c5b0d5"],"outputs":1,"useDifferentColor":false,"className":"","x":1080,"y":3100,"wires":[[]]},{"id":"b78dca6feeef20c5","type":"influxdb in","z":"da97d878.d3d728","influxdb":"1f7575cc.59429a","name":"Temp BME280_2","query":"import \"math\"\n\nfrom(bucket:\"sensordb\")\n |> range(start: -30h)\n |> filter(fn: (r) => \n r._measurement == \"BME280_2\" and \n r._field == \"temp\")\n |> aggregateWindow(every: 5m, fn: mean, createEmpty: true)\n |> map(fn: (r) => ({ r with _value: math.round(x: r._value * 100.0) / 100.0, result: \"BME280_2\" }))\n","rawOutput":true,"precision":"","retentionPolicy":"","org":"dibu","x":470,"y":3140,"wires":[["09ae60fb40ab8f66"]]},{"id":"321c226b49288336","type":"influxdb in","z":"da97d878.d3d728","influxdb":"1f7575cc.59429a","name":"Temp BME280_1","query":"import \"math\"\n\nfrom(bucket:\"sensordb\")\n |> range(start: -30h)\n |> filter(fn: (r) => \n r._measurement == \"BME280_1\" and \n r._field == \"temp\")\n |> aggregateWindow(every: 5m, fn: mean, createEmpty: false)\n |> map(fn: (r) => ({ r with _value: math.round(x: r._value * 100.0) / 100.0, result: \"BME280_1\" }))\n","rawOutput":true,"precision":"","retentionPolicy":"","org":"dibu","x":470,"y":3100,"wires":[["09ae60fb40ab8f66"]]},{"id":"09ae60fb40ab8f66","type":"join","z":"da97d878.d3d728","name":"","mode":"custom","build":"object","property":"payload","propertyType":"msg","key":"payload[0].result","joiner":"\\n","joinerType":"str","useparts":false,"accumulate":false,"timeout":"10","count":"2","reduceRight":false,"reduceExp":"","reduceInit":"","reduceInitType":"","reduceFixup":"","x":650,"y":3100,"wires":[["0ae326d01caa0ad1","12c836316b42c423"]]},{"id":"0ae326d01caa0ad1","type":"change","z":"da97d878.d3d728","name":"prep chart v05 multi","rules":[{"t":"set","p":"payload","pt":"msg","to":"[{\t \"series\": $keys($.payload),\t \"labels\": $keys($.payload) ~> $map(function($v) { \"\" }),\t \"data\": $keys($.payload) ~> $map(function($key) {\t $lookup($.payload, $key) ~> $map(function($i) { $i.(_value != null ? {\"x\":$toMillis(_time), \"y\":_value}) })\t })\t}]\t","tot":"jsonata"}],"action":"","property":"","from":"","to":"","reg":false,"x":860,"y":3100,"wires":[["28251290fdb6a371","7c2fe234d4b7eab1"]]},{"id":"28251290fdb6a371","type":"debug","z":"da97d878.d3d728","name":"","active":true,"tosidebar":true,"console":false,"tostatus":false,"complete":"false","statusVal":"","statusType":"auto","x":1090,"y":3140,"wires":[]},{"id":"12c836316b42c423","type":"debug","z":"da97d878.d3d728","name":"","active":true,"tosidebar":true,"console":false,"tostatus":false,"complete":"payload","targetType":"msg","statusVal":"","statusType":"auto","x":830,"y":3140,"wires":[]},{"id":"7f797fc9f4a11277","type":"ui_group","name":"all temp","tab":"0b521dca2f883ade","order":1,"disp":false,"width":"24","collapse":false,"className":""},{"id":"1f7575cc.59429a","type":"influxdb","hostname":"influxdb","port":"8086","protocol":"http","database":"sensordb","name":"","usetls":false,"tls":"","influxdbVersion":"2.0","url":"http://influxdb2:8086","timeout":"","rejectUnauthorized":false},{"id":"0b521dca2f883ade","type":"ui_tab","name":"Chart Temp","icon":"dashboard","order":2,"disabled":false,"hidden":false}]
```
The result of each query is joined in the join node (mode key/value Object) and then converted in the required form for the graph. In case more queries are required, increase number of inputs in join node.

Data shown via debug nodes:

JSONata for transformation:
```auto
[{
"series": $keys($.payload),
"labels": $keys($.payload) ~> $map(function($v) { "" }),
"data": $keys($.payload) ~> $map(function($key) {
$lookup($.payload, $key) ~> $map(function($i) {
$i.(_value != null ? {"x":$toMillis(_time), "y":_value}) })
})
}]
```
The diagram looks like this:
---
### Author:  [@grant1](https://discourse.nodered.org/u/grant1)
#### Post date: [8 March 2025 01:37 UTC](https://discourse.nodered.org/t/influxdb-v2-how-to-combine-multiple-queries-to-show-in-one-graph/95778/4 "2025-03-08T01:37:22Z")
Hi @cameo69
I think if you want to have the output from two different buckets combined into one single output table, you would need a union function.
```auto
bme280_data = from(bucket: "sensordb")
|> range(start: -30h)
|> filter(fn: (r) =>
r._measurement == "BME280" and
r._field == "temp")
|> aggregateWindow(every: 5m, fn: mean, createEmpty: false)
|> map(fn: (r) => ({ r with _value: math.round(x: r._value) }))
other_data = from(bucket: "otherdb")
|> range(start: -30h)
|> filter(fn: (r) =>
r._measurement == "OtherSensor" and
r._field == "temp")
|> aggregateWindow(every: 5m, fn: mean, createEmpty: false)
|> map(fn: (r) => ({ r with _value: math.round(x: r._value) }))
union(tables: [bme280_data, other_data])
```
Also, as InfluxData now has all 3 query languages in circulation, I created [this](https://grafana.com/blog/2023/12/29/a-comparison-of-influxql-sql-and-flux-query-languages-for-grafana-dashboards/) a while back along with some [sample dashboards](https://play.grafana.org/d/dea43745-7fac-4bf4-85d0-d06b168de92b/5ada39be-866c-51c5-ae0c-f514df881f41?orgId=1&from=now-7d&to=now&timezone=utc) to help navigate through the confusion.
---
### Author:  [@cameo69](https://discourse.nodered.org/u/cameo69)
#### Post date: [8 March 2025 11:39 UTC](https://discourse.nodered.org/t/influxdb-v2-how-to-combine-multiple-queries-to-show-in-one-graph/95778/5 "2025-03-08T11:39:58Z")
> [@grant1](#):
>
> `union(tables: [bme280_data, other_data])`
That’s an interesting suggestion, but when I do that, it joins the two data sets vertically, like a normal UNION in SQL would do.
Then I also have to dissect those lines afterwards to get them shown as separate lines in the graph node.
Or am I missing something?
---
### Author:  [@cameo69](https://discourse.nodered.org/u/cameo69)
#### Post date: [8 March 2025 11:46 UTC](https://discourse.nodered.org/t/influxdb-v2-how-to-combine-multiple-queries-to-show-in-one-graph/95778/6 "2025-03-08T11:46:18Z")
> [@grant1](#):
>
> I created [this](https://grafana.com/blog/2023/12/29/a-comparison-of-influxql-sql-and-flux-query-languages-for-grafana-dashboards/) a while back along
That’s helpful!
---
### Author:  [@grant1](https://discourse.nodered.org/u/grant1)
#### Post date: [8 March 2025 12:46 UTC](https://discourse.nodered.org/t/influxdb-v2-how-to-combine-multiple-queries-to-show-in-one-graph/95778/7 "2025-03-08T12:46:59Z")
Not sure how to fix the union. Usually I just hammer away in the Influx Data Explorer query editor and view the results until I get what I am after. I have not typically experimented with running Flux queries in Node-RED, so there may be a few tweaks to make.
---
### Author:  [@system](https://discourse.nodered.org/u/system)
#### Post date: [6 June 2025 12:47 UTC](https://discourse.nodered.org/t/influxdb-v2-how-to-combine-multiple-queries-to-show-in-one-graph/95778/8 "2025-06-06T12:47:00Z")
This topic was automatically closed 90 days after the last reply. New replies are no longer allowed.