# Problem getting Graph to display
**URL:** https://discourse.nodered.org/t/problem-getting-graph-to-display/24265
**Category:** Dashboard
**Created:** [5 April 2020 12:05 UTC](https://discourse.nodered.org/t/problem-getting-graph-to-display/24265 "2020-04-05T12:05:20Z")
**Posts on this page:** 20
**Page:** 1
### Author:  [@warnert](https://discourse.nodered.org/u/warnert)
#### Post date: [5 April 2020 12:05 UTC](https://discourse.nodered.org/t/problem-getting-graph-to-display/24265/1 "2020-04-05T12:05:20Z")
I am trying to get a graph from my roomtemperature.
I found some examples and it took me a while to get them working but I managed.
I have a database with an ID, sensornumber, value and a sql generated timestamp.
Whatever I try, I don't see anything on my graph.
This is my flow:
```auto
[{"id":"57ae6962.0687b8","type":"tab","label":"Grafiek kamertemp","disabled":false,"info":""},{"id":"4bfec7e1.b008c","type":"template","z":"57ae6962.0687b8","name":"format query wk","field":"topic","fieldType":"msg","format":"handlebars","syntax":"mustache","template":"SELECT mw_data \nFROM meetwaarden \nWHERE mw_se_id = 1\n AND mw_timestamp > \"{{payload}}\"","output":"str","x":660,"y":80,"wires":[["a7458f1c.229c78","78527ea9.9c2d68"]]},{"id":"e555e6b6.6a363","type":"debug","z":"57ae6962.0687b8","name":"1","active":false,"tosidebar":true,"console":false,"tostatus":false,"complete":"payload","targetType":"msg","x":630,"y":40,"wires":[]},{"id":"a7458f1c.229c78","type":"debug","z":"57ae6962.0687b8","name":"2","active":false,"tosidebar":true,"console":false,"tostatus":false,"complete":"payload","targetType":"msg","x":870,"y":80,"wires":[]},{"id":"9abd05c0.629ab","type":"function","z":"57ae6962.0687b8","name":"convert","func":"if ( !msg.timestamp ) msg.timestamp = Math.round(+new Date());\n\nvar dt = new Date(msg.payload);\nvar Y = dt.getFullYear().toString();\nvar M = (dt.getMonth() + 1).toString();\nif((dt.getMonth() + 1)<=9){M='0'+M}\nvar D = dt.getDate().toString();\nif(dt.getDate()<=9){D='0'+D}\nvar H = dt.getHours().toString();\nif(dt.getHours()<=9){H='0'+H}\nvar m = dt.getMinutes().toString();\nif(dt.getMinutes()<=9){m='0'+m}\n//var S = dt.getMilliseconds().toString();\nmsg.payload = Y+'-'+M+'-'+D+' '+H+':'+m+':'+'00';\n\nreturn msg;","outputs":1,"noerr":0,"x":440,"y":80,"wires":[["e555e6b6.6a363","4bfec7e1.b008c"]]},{"id":"6ef19a5d.2508d4","type":"inject","z":"57ae6962.0687b8","name":"","topic":"","payload":"","payloadType":"date","repeat":"","crontab":"","once":false,"onceDelay":0.1,"x":100,"y":80,"wires":[["84775b33.2d0af"]]},{"id":"77b08af2.e488d4","type":"ui_chart","z":"57ae6962.0687b8","name":"Kamer temperatuur","group":"d3e2514d.48f4c","order":1,"width":0,"height":0,"label":"Kamer temperatuur","chartType":"line","legend":"false","xformat":"HH:mm","interpolate":"linear","nodata":"","dot":false,"ymin":"","ymax":"","removeOlder":"24","removeOlderPoints":"","removeOlderUnit":"3600","cutout":0,"useOneColor":false,"useUTC":false,"colors":["#1f77b4","#aec7e8","#ff7f0e","#2ca02c","#98df8a","#d62728","#ff9896","#9467bd","#c5b0d5"],"useOldStyle":false,"outputs":1,"x":610,"y":180,"wires":[["4373954c.03ee0c"]]},{"id":"8525cd85.66fa48","type":"change","z":"57ae6962.0687b8","name":"Format data WK","rules":[{"t":"set","p":"payload","pt":"msg","to":"(\t $series := [\t { \"field\": \"mw_data\", \"label\": \"Kamertemp\" }\t];\t $xaxis := \"timestamp\";\t [\t {\t \"series\": $series.label,\t \"data\": $series.[\t (\t $yaxis := $.field;\t $$.payload.{\t \"x\": $lookup($, $xaxis),\t \"y\": $lookup($, $yaxis)\t }\t )\t]\t }\t ]\t)","tot":"jsonata"}],"action":"","property":"","from":"","to":"","reg":false,"x":340,"y":180,"wires":[["ab2f4d1e.a881f8","77b08af2.e488d4"]]},{"id":"78527ea9.9c2d68","type":"mysql","z":"57ae6962.0687b8","mydb":"98a864b9.d0edb","name":"MYSQL","x":120,"y":180,"wires":[["2b2c2b71.f0d6cc","8525cd85.66fa48"]]},{"id":"2b2c2b71.f0d6cc","type":"debug","z":"57ae6962.0687b8","name":"3","active":true,"tosidebar":true,"console":false,"tostatus":false,"complete":"payload","targetType":"msg","x":310,"y":240,"wires":[]},{"id":"ab2f4d1e.a881f8","type":"debug","z":"57ae6962.0687b8","name":"4","active":true,"tosidebar":true,"console":false,"tostatus":false,"complete":"payload","targetType":"msg","x":530,"y":240,"wires":[]},{"id":"84775b33.2d0af","type":"function","z":"57ae6962.0687b8","name":"Criteria","func":"var timeE = msg.payload;\n//Restrict the query to pull the last 24hrs\n//of data instead of the whole db\nmsg.payload = (timeE - (1000*60*5));\n node.status({text:msg.payload});\nreturn msg;","outputs":1,"noerr":0,"x":260,"y":80,"wires":[["9abd05c0.629ab"]]},{"id":"4373954c.03ee0c","type":"debug","z":"57ae6962.0687b8","name":"5","active":true,"tosidebar":true,"console":false,"tostatus":false,"complete":"payload","targetType":"msg","x":810,"y":240,"wires":[]},{"id":"d3e2514d.48f4c","type":"ui_group","z":"","name":"Grafieken","tab":"e62eb9b.f9d3cc8","order":2,"disp":true,"width":"6","collapse":false},{"id":"98a864b9.d0edb","type":"MySQLdatabase","z":"","name":"","host":"127.0.0.1","port":"3306","db":"Huismanager","tz":""},{"id":"e62eb9b.f9d3cc8","type":"ui_tab","z":"","name":"Grafieken","icon":"dashboard","order":2,"disabled":false,"hidden":false}]
```
this is what is displayed by debug3:
```auto
5-4-2020 13:36:24node: 3
SELECT mw_data FROM meetwaarden WHERE mw_se_id = 1 AND mw_timestamp > "2020-04-05 13:31:00" : msg.payload : array[6]
array[6]
0: object
mw_data: "21.84"
1: object
mw_data: "21.85"
2: object
mw_data: "21.84"
3: object
mw_data: "21.85"
4: object
mw_data: "21.87"
5: object
mw_data: "21.92"
```
I tried to modify the javascript in the "Format data WK" but I am sure I do something wrong (otherwise it would have worked)
Can anybody give me some hint how to get this working?
-Warner-
---
### Author:  [@bakman2](https://discourse.nodered.org/u/bakman2)
#### Post date: [5 April 2020 12:12 UTC](https://discourse.nodered.org/t/problem-getting-graph-to-display/24265/2 "2020-04-05T12:12:26Z")
If you want to display an array of data, you need to provide the x-axis (time) and a value for the y-axis.
See [the documentation](https://github.com/node-red/node-red-dashboard/blob/master/Charts.md)
---
### Author:  [@warnert](https://discourse.nodered.org/u/warnert)
#### Post date: [5 April 2020 14:28 UTC](https://discourse.nodered.org/t/problem-getting-graph-to-display/24265/3 "2020-04-05T14:28:29Z")
I cannot figure out how to do it with that info.
I tried the JSONata excercise but I do not understand anything of it
---
### Author:  [@bakman2](https://discourse.nodered.org/u/bakman2)
#### Post date: [5 April 2020 14:43 UTC](https://discourse.nodered.org/t/problem-getting-graph-to-display/24265/4 "2020-04-05T14:43:38Z")
The chart accepts 3 types of data:
timebased, non-time based, (and/or) live data
Do you want a line or barchart ?
For a timebased line chart `msg.payload` needs to be formatted like (example has 3 series, you have only 1):
```auto
[{
"series": ["A", "B", "C"],
"data": [
[{ "x": 1504029632890, "y": 5 },
{ "x": 1504029636001, "y": 4 },
{ "x": 1504029638656, "y": 2 }
],
[{ "x": 1504029633514, "y": 6 },
{ "x": 1504029636622, "y": 7 },
{ "x": 1504029639539, "y": 6 }
],
[{ "x": 1504029634400, "y": 7 },
{ "x": 1504029637959, "y": 7 },
{ "x": 1504029640317, "y": 7 }
]
],
"labels": [""]
}]
```
So your array with objects needs to be reformatted as such, either with a function node or jsonata.
On google you can find many examples on how to deal with arrays/objects and rewriting them. The `x` values are unix timestamps. The query should include the timestamps (eg. SELECT mw\_timestamp,mw\_data) to make it easier, the database can also convert the timestamp directly in the correct format (ie; select UNIX\_TIMESTAMP(mw\_timestamp) - depending on the type of database and correct timestamp format)
---
### Author:  [@warnert](https://discourse.nodered.org/u/warnert)
#### Post date: [8 April 2020 11:44 UTC](https://discourse.nodered.org/t/problem-getting-graph-to-display/24265/5 "2020-04-08T11:44:16Z")
Sorry, but all I can find as examples are different layouts. I tried JSONata but that gives no output either. And the problem is that now the timestamp has a label UNIX\_TIMESTAMP(mw\_timestamp).
I am getting desperate.
And there are a lot of beginners who have problems with this so this is not easy. I think I have to skip graphs.
---
### Author:  [@Steve-Mcl](https://discourse.nodered.org/u/Steve-Mcl)
#### Post date: [8 April 2020 11:53 UTC](https://discourse.nodered.org/t/problem-getting-graph-to-display/24265/6 "2020-04-08T11:53:46Z")
Provide the following and we'll show you how...
- Your SQL query (include TOP 10 to limit size to small sample)
- Sample output data - as copied from the a debug output
- What graph style you want (line/bar)
- What field the X value is, what field the Y value is
---
### Author:  [@warnert](https://discourse.nodered.org/u/warnert)
#### Post date: [8 April 2020 14:26 UTC](https://discourse.nodered.org/t/problem-getting-graph-to-display/24265/7 "2020-04-08T14:26:10Z")
I have now this:
```auto
[{"id":"4bfec7e1.b008c","type":"template","z":"57ae6962.0687b8","name":"format query wk","field":"topic","fieldType":"msg","format":"handlebars","syntax":"mustache","template":"SELECT UNIX_TIMESTAMP(mw_timestamp),mw_data \nFROM meetwaarden \nWHERE mw_se_id = 1\n AND mw_timestamp > \"{{payload}}\"","output":"str","x":660,"y":80,"wires":[["a7458f1c.229c78","78527ea9.9c2d68"]]},{"id":"e555e6b6.6a363","type":"debug","z":"57ae6962.0687b8","name":"1","active":false,"tosidebar":true,"console":false,"tostatus":false,"complete":"payload","targetType":"msg","x":630,"y":40,"wires":[]},{"id":"a7458f1c.229c78","type":"debug","z":"57ae6962.0687b8","name":"2","active":true,"tosidebar":true,"console":false,"tostatus":false,"complete":"payload","targetType":"msg","x":870,"y":80,"wires":[]},{"id":"9abd05c0.629ab","type":"function","z":"57ae6962.0687b8","name":"convert","func":"if ( !msg.timestamp ) msg.timestamp = Math.round(+new Date());\n\nvar dt = new Date(msg.payload);\nvar Y = dt.getFullYear().toString();\nvar M = (dt.getMonth() + 1).toString();\nif((dt.getMonth() + 1)<=9){M='0'+M}\nvar D = dt.getDate().toString();\nif(dt.getDate()<=9){D='0'+D}\nvar H = dt.getHours().toString();\nif(dt.getHours()<=9){H='0'+H}\nvar m = dt.getMinutes().toString();\nif(dt.getMinutes()<=9){m='0'+m}\n//var S = dt.getMilliseconds().toString();\nmsg.payload = Y+'-'+M+'-'+D+' '+H+':'+m+':'+'00';\n\nreturn msg;","outputs":1,"noerr":0,"x":440,"y":80,"wires":[["e555e6b6.6a363","4bfec7e1.b008c"]]},{"id":"6ef19a5d.2508d4","type":"inject","z":"57ae6962.0687b8","name":"","topic":"","payload":"","payloadType":"date","repeat":"","crontab":"","once":false,"onceDelay":0.1,"x":100,"y":80,"wires":[["84775b33.2d0af"]]},{"id":"77b08af2.e488d4","type":"ui_chart","z":"57ae6962.0687b8","name":"Kamer temperatuur","group":"d3e2514d.48f4c","order":1,"width":0,"height":0,"label":"Kamer temperatuur","chartType":"line","legend":"false","xformat":"HH:mm","interpolate":"linear","nodata":"","dot":false,"ymin":"","ymax":"","removeOlder":"24","removeOlderPoints":"100","removeOlderUnit":"604800","cutout":0,"useOneColor":false,"useUTC":false,"colors":["#1f77b4","#aec7e8","#ff7f0e","#2ca02c","#98df8a","#d62728","#ff9896","#9467bd","#c5b0d5"],"useOldStyle":false,"outputs":1,"x":610,"y":180,"wires":[["4373954c.03ee0c"]]},{"id":"8525cd85.66fa48","type":"change","z":"57ae6962.0687b8","name":"Format data WK","rules":[{"t":"set","p":"payload","pt":"msg","to":"(\t $series := [\t { \"field\": \"mw_data\", \"label\": \"Kamertemp\" }\t];\t $xaxis := \"UNIX_TIMESTAMP(mw_timestamp)\";\t [\t {\t \"series\": $series.label,\t \"data\": $series.[\t (\t $yaxis := $.field;\t $$.payload.{\t \"x\": $lookup($, $xaxis),\t \"y\": $lookup($, $yaxis)\t }\t )\t]\t }\t ]\t)","tot":"jsonata"}],"action":"","property":"","from":"","to":"","reg":false,"x":340,"y":180,"wires":[["ab2f4d1e.a881f8","77b08af2.e488d4"]]},{"id":"78527ea9.9c2d68","type":"mysql","z":"57ae6962.0687b8","mydb":"98a864b9.d0edb","name":"MYSQL","x":120,"y":180,"wires":[["2b2c2b71.f0d6cc","8525cd85.66fa48"]]},{"id":"2b2c2b71.f0d6cc","type":"debug","z":"57ae6962.0687b8","name":"3","active":true,"tosidebar":true,"console":false,"tostatus":false,"complete":"payload","targetType":"msg","x":310,"y":240,"wires":[]},{"id":"ab2f4d1e.a881f8","type":"debug","z":"57ae6962.0687b8","name":"4","active":true,"tosidebar":true,"console":false,"tostatus":false,"complete":"payload","targetType":"msg","x":530,"y":240,"wires":[]},{"id":"84775b33.2d0af","type":"function","z":"57ae6962.0687b8","name":"Criteria","func":"var timeE = msg.payload;\n//Restrict the query to pull the last 24hrs\n//of data instead of the whole db\nmsg.payload = (timeE - (1000*60*5));\n node.status({text:msg.payload});\nreturn msg;","outputs":1,"noerr":0,"x":260,"y":80,"wires":[["9abd05c0.629ab"]]},{"id":"4373954c.03ee0c","type":"debug","z":"57ae6962.0687b8","name":"5","active":true,"tosidebar":true,"console":false,"tostatus":false,"complete":"payload","targetType":"msg","x":810,"y":240,"wires":[]},{"id":"d3e2514d.48f4c","type":"ui_group","z":"","name":"Grafieken","tab":"e62eb9b.f9d3cc8","order":2,"disp":true,"width":"6","collapse":false},{"id":"98a864b9.d0edb","type":"MySQLdatabase","z":"","name":"","host":"127.0.0.1","port":"3306","db":"Huismanager","tz":""},{"id":"e62eb9b.f9d3cc8","type":"ui_tab","z":"","name":"Grafieken","icon":"dashboard","order":2,"disabled":false,"hidden":false}]
```
Which gives me at debug 4:
```auto
8-4-2020 16:15:39node: 4
SELECT UNIX_TIMESTAMP(mw_timestamp),mw_data FROM meetwaarden WHERE mw_se_id = 1 AND mw_timestamp > "2020-04-08 16:10:00" : msg.payload : array[1]
array[1]
0: object
series: "Kamertemp"
data: array[6]
0: object
x: 1586355009
y: "23.65"
1: object
x: 1586355069
y: "23.66"
2: object
x: 1586355129
y: "23.67"
3: object
x: 1586355189
y: "23.67"
4: object
x: 1586355249
y: "23.67"
5: object
x: 1586355309
y: "23.67"
```
I now have the x and the y and still the graph is empty...
Is now the timestamp (x) too small?
This is what I have in my Format data WK:
```auto
(
$series := [
{ "field": "mw_data", "label": "Kamertemp" }
];
$xaxis := "UNIX_TIMESTAMP(mw_timestamp)";
[
{
"series": $series.label,
"data": $series.[
(
$yaxis := $.field;
$$.payload.{
"x": $lookup($, $xaxis),
"y": $lookup($, $yaxis)
}
)
]
}
]
)
```
I was a little desperate, but cannot give up 😉 And time enough through covid-19....
---
### Author:  [@Steve-Mcl](https://discourse.nodered.org/u/Steve-Mcl)
#### Post date: [8 April 2020 14:35 UTC](https://discourse.nodered.org/t/problem-getting-graph-to-display/24265/8 "2020-04-08T14:35:30Z")
We need your original data not processed data....
> [@Steve-Mcl](#):
>
> Sample output data - as copied from the a debug output
use the copy button in debug bar

---
### Author:  [@bakman2](https://discourse.nodered.org/u/bakman2)
#### Post date: [8 April 2020 15:19 UTC](https://discourse.nodered.org/t/problem-getting-graph-to-display/24265/9 "2020-04-08T15:19:00Z")
Forgot you need to have the timestamp in nano seconds, could you try UNIX\_TIMESTAMP(mw\_timestamp)\*1000
---
### Author:  [@warnert](https://discourse.nodered.org/u/warnert)
#### Post date: [8 April 2020 16:33 UTC](https://discourse.nodered.org/t/problem-getting-graph-to-display/24265/10 "2020-04-08T16:33:47Z")
I found this to multiply by 1000:
```auto
(
$series := [
{ "field": "mw_data", "label": "Kamertemp" }
];
$xaxis := "UNIX_TIMESTAMP(mw_timestamp)";
[
{
"series": $series.label,
"data": $series.[
(
$yaxis := $.field;
$$.payload.{
"x": $lookup($, $xaxis)*1000,
"y": $lookup($, $yaxis)
}
)
]
}
]
)
```
Now I have 🙂 (yes, 13 digits)
```auto
data: array[6]
0: object
x: 1586363049000
y: "23.54"
```
and still no line in the graph....
---
### Author:  [@bakman2](https://discourse.nodered.org/u/bakman2)
#### Post date: [8 April 2020 16:36 UTC](https://discourse.nodered.org/t/problem-getting-graph-to-display/24265/11 "2020-04-08T16:36:09Z")
Don't forget the labels field (even if not used).
And series needs to be an array (same for labels)
---
### Author:  [@warnert](https://discourse.nodered.org/u/warnert)
#### Post date: [8 April 2020 16:42 UTC](https://discourse.nodered.org/t/problem-getting-graph-to-display/24265/12 "2020-04-08T16:42:40Z")
Hmm, I followed [https://flows.nodered.org/flow/13c55d1aa11e864609e24fa534a1fa26](https://flows.nodered.org/flow/13c55d1aa11e864609e24fa534a1fa26)
and there is no labels field used there...
---
### Author:  [@bakman2](https://discourse.nodered.org/u/bakman2)
#### Post date: [8 April 2020 16:43 UTC](https://discourse.nodered.org/t/problem-getting-graph-to-display/24265/13 "2020-04-08T16:43:49Z")
[Chart documentation](https://github.com/node-red/node-red-dashboard/blob/master/Charts.md)
> To display a complete chart in one go - for example from a set of points retrieved from a database, the data must be supplied in the form of an array, that holds an object that has `series` , `labels` , and `data` arrays. This is broadly the same as the raw format used by the angular chart.js library.
> **You will need to process your data into this structure in order to render it correctly.**
---
### Author:  [@Brew](https://discourse.nodered.org/u/Brew)
#### Post date: [8 April 2020 18:44 UTC](https://discourse.nodered.org/t/problem-getting-graph-to-display/24265/14 "2020-04-08T18:44:16Z")
> [@warnert](#):
>
> "57ae6962.0687b8","type":"tab","label":"Grafiek kamertemp","disabled":false,"info":""},{"id":"4bfec7e1.b008c","type":"template","z":"57ae6962.0687b8","name":"format query wk","field":"topic","fieldType":"msg","format":"handlebars","syntax":"mustache","template":"SELECT mw\_data \nFROM meetwaarden \nWHERE mw\_se\_id = 1\n AND mw\_timestamp \> "{{payload}}"","output":"str","x":660,"y":80,"wires":[["a7458f1c.229c78","78527ea9.9c2d68"]]},{"id":"e555e6b6.6a363","type":"debug","z":"57ae6962.0687b8","name":"1","active":false,"tosidebar":true,"console":false,"tostatus":false,"complete
Hi Warnert, I've got it cooking here, this is the raw data off my temperature sensor (a Philips Hue Motion sensor)
`{"celsius":19.44,"fahrenheit":66.99,"deviceValue":1944.0000000000002,"updated":"2020-04-08T19:34:01+01:00"}`
I then pass this to a function node
```auto
return [
{ payload: msg.payload.celsius },
];
```
and then to a dashboard gauge and chart.


Hope this helps
---
### Author:  [@bakman2](https://discourse.nodered.org/u/bakman2)
#### Post date: [8 April 2020 18:54 UTC](https://discourse.nodered.org/t/problem-getting-graph-to-display/24265/15 "2020-04-08T18:54:38Z")
Yes but he wants timeseries, not a single value.
---
### Author:  [@Brew](https://discourse.nodered.org/u/Brew)
#### Post date: [8 April 2020 19:57 UTC](https://discourse.nodered.org/t/problem-getting-graph-to-display/24265/16 "2020-04-08T19:57:39Z")
apologies my bad
---
### Author:  [@warnert](https://discourse.nodered.org/u/warnert)
#### Post date: [8 April 2020 20:52 UTC](https://discourse.nodered.org/t/problem-getting-graph-to-display/24265/17 "2020-04-08T20:52:52Z")
Ok, I found something. This is now my JSONata:
```auto
(
$series := [
{ "field": "mw_data", "label": "Kamertemp" }
];
$xaxis := "UNIX_TIMESTAMP(mw_timestamp)";
[
{
"series": [$series.label],
"labels": [$series.label],
"data": $series.[
(
$yaxis := $.field;
$$.payload.{
"x": $lookup($, $xaxis)*1000,
"y": $lookup($, $yaxis)
}
)
]
}
]
)
```
In the debug window I get now:
```auto
8-4-2020 22:37:05node: 4
SELECT UNIX_TIMESTAMP(mw_timestamp),mw_data FROM meetwaarden WHERE mw_se_id = 1 AND mw_timestamp > "2020-04-08 22:32:00" : msg.payload : array[1]
array[1]
0: object
series: array[1]
labels: array[1]
data: array[5]
0: object
x: 1586377929000
y: "22.08"
1: object
2: object
3: object
4: object
```
So as you said series and labels are now arrays, but still no line 😥
---
### Author:  [@bakman2](https://discourse.nodered.org/u/bakman2)
#### Post date: [8 April 2020 20:55 UTC](https://discourse.nodered.org/t/problem-getting-graph-to-display/24265/18 "2020-04-08T20:55:58Z")
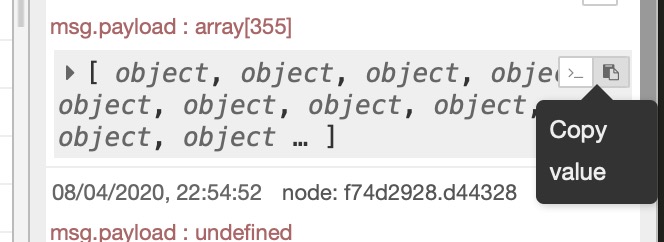
In debug window click this icon to copy the actual debug output and paste it here
---
### Author:  [@warnert](https://discourse.nodered.org/u/warnert)
#### Post date: [8 April 2020 20:58 UTC](https://discourse.nodered.org/t/problem-getting-graph-to-display/24265/19 "2020-04-08T20:58:29Z")
```auto
[{"series":["Kamertemp"],"labels":["Kamertemp"],"data":[{"x":1586379130000,"y":"22.02"},{"x":1586379190000,"y":"22.01"},{"x":1586379250000,"y":"21.98"},{"x":1586379310000,"y":"21.99"},{"x":1586379370000,"y":"21.98"},{"x":1586379430000,"y":"21.99"}]}]
```
This is just before the chart node
---
### Author:  [@bakman2](https://discourse.nodered.org/u/bakman2)
#### Post date: [8 April 2020 21:00 UTC](https://discourse.nodered.org/t/problem-getting-graph-to-display/24265/20 "2020-04-08T21:00:47Z")
the values are strings, should be numbers
[Next page](https://discourse.nodered.org/t/problem-getting-graph-to-display/24265.md?page=2)