# Simple debugging of Dashboard Widget
**URL:** https://discourse.nodered.org/t/simple-debugging-of-dashboard-widget/7530
**Category:** Developing Nodes
**Created:** [3 February 2019 16:38 UTC](https://discourse.nodered.org/t/simple-debugging-of-dashboard-widget/7530 "2019-02-03T16:38:23Z")
**Posts on this page:** 17
**Page:** 1
### Author:  [@Colin](https://discourse.nodered.org/u/Colin)
#### Post date: [3 February 2019 16:38 UTC](https://discourse.nodered.org/t/simple-debugging-of-dashboard-widget/7530/1 "2019-02-03T16:38:23Z")
I am trying to do some simple debugging of the client side of a Dashboard Widget `node-red-contrib-ui-led`. I just want to be able to follow the flow to see if execution is getting where it should, so something like alert() or console.log() or similar would be perfectly adequate, but I can't make either of those work. Is there something along those lines that I can use?
---
### Author:  [@TotallyInformation](https://discourse.nodered.org/u/TotallyInformation)
#### Post date: [3 February 2019 16:43 UTC](https://discourse.nodered.org/t/simple-debugging-of-dashboard-widget/7530/2 "2019-02-03T16:43:22Z")
You should be able to use `console` for the front-end debugging. And of course, you should be able to use your developer view not only to see the console output but also to do clever things like set breakpoints so that code pauses where you want to and then you can use the console to check current values, etc.
---
### Author:  [@dceejay](https://discourse.nodered.org/u/dceejay)
#### Post date: [3 February 2019 16:49 UTC](https://discourse.nodered.org/t/simple-debugging-of-dashboard-widget/7530/3 "2019-02-03T16:49:58Z")
Hi @Colin - yes if I edit (in your example) `led.js` line 66 to insert
```
console.log("MSG:",msg);
```
Then I have to stop and restart Node-RED - reload the browser - flush the cache (Ctrl-R a couple of times) then click the inject I get the following in the browser developer tools console.
```auto
MSG: undefined
MSG: {_msgid: "611b265b.3ab278", topic: "", payload: true}
```
---
### Author:  [@Colin](https://discourse.nodered.org/u/Colin)
#### Post date: [3 February 2019 17:22 UTC](https://discourse.nodered.org/t/simple-debugging-of-dashboard-widget/7530/4 "2019-02-03T17:22:30Z")
Thanks, that is what I expected should work. But I get nothing when I inject a message, which likely explains why the LED never does anything.
I have just tried node-red-contrib-ui\_list with the example from the readme and it shows the lists ok (I think), but when I click to select the days of the week, for example, I think it should send on a message, but it doesn't. So it looks as if I may have a problem with the dashboard widgets. @Trying_to_learn has apparently the same problem with the led node.
```auto
3 Feb 17:16:16 - [info] Node-RED version: v0.19.5
3 Feb 17:16:16 - [info] Node.js version: v10.15.1
3 Feb 17:16:16 - [info] Linux 4.18.0-13-generic x64 LE
3 Feb 17:16:16 - [info] Loading palette nodes
3 Feb 17:16:17 - [warn] rpi-gpio : Raspberry Pi specific node set inactive
3 Feb 17:16:17 - [warn] rpi-gpio : Cannot find Pi RPi.GPIO python library
3 Feb 17:16:17 - [info] Dashboard version 2.13.2 started at /ui
```
---
### Author:  [@Colin](https://discourse.nodered.org/u/Colin)
#### Post date: [4 February 2019 11:35 UTC](https://discourse.nodered.org/t/simple-debugging-of-dashboard-widget/7530/5 "2019-02-04T11:35:55Z")
Well I am even more confused now, I convinced myself this must be a conflict with another node installed so I stopped node-red, renamed the `.node-red` folder and restarted node-red, so it made a new empty flow, settings file etc. Then I installed `node-red-dashboard` and `node-red-contrib-ui-led` and built a simple flow with two inject nodes and the led node, but it still doesn't respond to messages.
`npm list -g --depth 0` shows this, I don't see anything untoward there
```bash
$ npm list -g --depth 0
/usr/lib
├── eslint@3.17.0
├── http-server@0.9.0
├── mocha@3.2.0
├── node-red@0.19.5
├── npm@6.4.1
├── nyc@10.1.2
└── webpack@3.7.1
```
So now I am completely stuck and can't think of anything else to do.
Help!!
---
### Author:  [@BartButenaers](https://discourse.nodered.org/u/BartButenaers)
#### Post date: [4 February 2019 13:21 UTC](https://discourse.nodered.org/t/simple-debugging-of-dashboard-widget/7530/6 "2019-02-04T13:21:58Z")
> [@Colin](#):
>
> but it still doesn't respond to messages
Hey Colin,
We will have to analyse it step by step ...
When you look at the node-red-contrib-ui-led [code](https://github.com/Adorkable/node-red-contrib-ui-led/blob/master/led.js#L82), you will see that the 'update' function is called as soon as a message arrives:
```auto
$scope.$watch('msg', update);
```
The dashboard handles automatically all the message communication for you, and stores the message on the AngularJs scope (see drawing [here](https://discourse.nodered.org/t/use-scope-in-ui-nodes/6804/8)). As soon as the msg on the scope is updated, the watch will detect the change an execute the 'update' callback function ...
So if I were you, I would add a `debugger` statement in that function:
```auto
var update = (msg) => {
debugger;
if (!msg) {
return;
}
```
If you open the developer tools of your browser, the debugger should stop at the `debugger` statement as soon as you inject a message.
- If you don't arrive at your statement, there must be an issue in the dashboard communication.
- If you arrive at your statement, the led-node isn't handling the input message content correctly ...
Bart
---
### Author:  [@Colin](https://discourse.nodered.org/u/Colin)
#### Post date: [4 February 2019 14:04 UTC](https://discourse.nodered.org/t/simple-debugging-of-dashboard-widget/7530/7 "2019-02-04T14:04:03Z")
Thanks @BartButenaers, your suggestion has inadvertently helped. It already seemed that it was not getting into `update` as console.log did not generate anything, however having put in the debugger statements and confirmed that it did not get there, I thought to try a different Browser and discovered that it is browser dependent. It works OK in Chrome and in Firefox ESR but doesn't in Waterfox. I use Waterfox for an add-on that is not available on the current FF.
The remaining question is, I suppose, whether this is just a bug in Waterfox or whether it is something that the node-red code can support. I have determined that it is not even calling initController, if that helps analyse it.
---
### Author:  [@TotallyInformation](https://discourse.nodered.org/u/TotallyInformation)
#### Post date: [4 February 2019 16:57 UTC](https://discourse.nodered.org/t/simple-debugging-of-dashboard-widget/7530/8 "2019-02-04T16:57:00Z")
You will need to take that up with Waterfox. Clearly something is different to more standard browsers.
If you want another alternative to the big 2, you might try Vivaldi, that is based on Chromium but doesn't have any of the Google ties though you can use extensions from the Chrome store if you like.
---
### Author:  [@dceejay](https://discourse.nodered.org/u/dceejay)
#### Post date: [4 February 2019 17:07 UTC](https://discourse.nodered.org/t/simple-debugging-of-dashboard-widget/7530/9 "2019-02-04T17:07:51Z")
On a clean vanilla install of Waterfox on Mac the ui-led node is working fine... maybe it's your plugins or something blocking websockets ?
---
### Author:  [@BartButenaers](https://discourse.nodered.org/u/BartButenaers)
#### Post date: [4 February 2019 18:58 UTC](https://discourse.nodered.org/t/simple-debugging-of-dashboard-widget/7530/10 "2019-02-04T18:58:24Z")
Hey Dave (@dceejay), I assume Colin's dashboard is working fine, except for his LED node? If that is the case, a blocked websocket would cause all his other widgets (graphs, ...) to fail showing data. Or not?
---
### Author:  [@dceejay](https://discourse.nodered.org/u/dceejay)
#### Post date: [4 February 2019 19:08 UTC](https://discourse.nodered.org/t/simple-debugging-of-dashboard-widget/7530/11 "2019-02-04T19:08:21Z")
true... but all widgets share the same comms pipe...
---
### Author:  [@Colin](https://discourse.nodered.org/u/Colin)
#### Post date: [4 February 2019 21:08 UTC](https://discourse.nodered.org/t/simple-debugging-of-dashboard-widget/7530/12 "2019-02-04T21:08:55Z")
> [@dceejay](#):
>
> true... but all widgets share the same comms pipe..
Well, as @BartButenaers suggests it is only on the ui-led and ui\_list that I am seeing any issues. Other Dashboard nodes work fine. So that suggests there must be some difference with the ui widgets.
Is initController run in the client? I think so, in which case that isn't getting called either, so it's probably not surprising that the messages don't get through.
I will try disabling addons, and try Waterfox accessing from another PC.
In fact it is not a big deal for me as I don't need these nodes, I only found it trying to work out what was the problem that @Trying_to_learn was having. We don't know yet which browser he is using, though I must say I shall be surprised if it is Waterfox.
---
### Author:  [@BartButenaers](https://discourse.nodered.org/u/BartButenaers)
#### Post date: [4 February 2019 21:38 UTC](https://discourse.nodered.org/t/simple-debugging-of-dashboard-widget/7530/13 "2019-02-04T21:38:17Z")
Hey Colin,
Unfortunately I'm not an AngularJs expert ...
If my boss at work should give me your issue to solve, I think I would start debugging. You can keep guessing one million reasons why it doesn't work. But in my opinion using the debugger, you most probably can pinpoint where the message is being thrown away...
And yes, easier said than done...
In case you have the courage to get started with it, here is how I think the messages are being passed between the Node-RED flow and the dashboard:

The red lines is a message from the flow to the dashboard, and the blue line is from the dashboard back to the flow. So in your case the message doesn't survive for some reason the red path ...
1. When an **input message** arrives on the dashboard node ...
2. Then the input handler function sends data to the websocket channel ([socket.io](https://socket.io/)).
3. In the dashboard, the message is being passed-through the UIEvents
4. The main.js class - which handles the logic for all widgets (button, ...) - will listen to those messages from UIEvents, and do something with it ...
5. When data needs to be send back to the flow, the data will be emitted back to the UIEvents.
6. The UIEvents will send the data back to the websocket channel.
7. The server flow will listen to data from the websocket channel.
8. As soon as data has arrived, an event will be triggered.
9. The event handler function will send an **output message** on the dashboard node output.
The _left part_ of the websocket channel is the server-side flow, and the _right part_ is the client-side dashboard. The dashboard can easily be debugged in your browser, but perhaps you should delete the .../node-red-dashboard/dist folder to avoid having to debug minified javascript code. The server side flow needs to be debugged by remote attaching a debugger to your node js server.
But I would start by debugging the dashboard, since that is the easiest part ...
Any suggestions ??
---
### Author:  [@Colin](https://discourse.nodered.org/u/Colin)
#### Post date: [4 February 2019 21:45 UTC](https://discourse.nodered.org/t/simple-debugging-of-dashboard-widget/7530/14 "2019-02-04T21:45:54Z")
Thanks again @BartButenaers but I have some more information. Trying Waterfox (same version, same OS) on another PC, connected to the flow that is giving the problems it works fine.
However, if I disable all the addons on the failing one it still fails, so it must be something messed up in my Waterfox profile I suppose, which is a right pain as I don't want to have to make a new profile. Not sure what I am going to do now.
---
### Author:  [@BartButenaers](https://discourse.nodered.org/u/BartButenaers)
#### Post date: [4 February 2019 22:09 UTC](https://discourse.nodered.org/t/simple-debugging-of-dashboard-widget/7530/15 "2019-02-04T22:09:35Z")
> [@Colin](#):
>
> ot sure what I am going to do now.
I don't know the answer, and I hope that it is a rhetorical question 🤣
> [@Colin](#):
>
> Is initController run in the client?
The answer is '_ **yes** _'.
You can test that easily by putting a debugger statement into the led.js file:

As soon as I refresh my dashboard page, my Chrome debugger stops there:
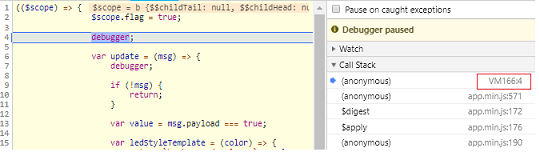
To summarize the led.js file contains _both server-side and client-side Javascript code_:
- Like all other _ **non-ui node** _, the led.js file contains the **server-side** Javascript code that runs in the Node-RED flow on top of NodeJs. This file contains the code to handle input messages, and so on ... When you should attach your debugger to the NodeJs server, you will see that the led.js file is there available.
- But since this contribution is a _ **ui-node** _, the led.js file also contains **client-side** Javascript code that runs in the dashboad on top of the browser. As you can see in the above screenshot, there is no led.js file available in the browser. Instead the initController function will be located its own (_ **generated** _) separate file...
---
### Author:  [@Colin](https://discourse.nodered.org/u/Colin)
#### Post date: [4 February 2019 22:23 UTC](https://discourse.nodered.org/t/simple-debugging-of-dashboard-widget/7530/16 "2019-02-04T22:23:44Z")
> [@BartButenaers](#):
>
> > Is initController run in the client?
>
> The answer is ' _ **yes** _ '.
That's what I thought. So on mine initController is not getting called, so it is not surprising that the messages don't get through.
---
### Author:  [@T0T4R4](https://discourse.nodered.org/u/T0T4R4)
#### Post date: [10 September 2019 10:57 UTC](https://discourse.nodered.org/t/simple-debugging-of-dashboard-widget/7530/17 "2019-09-10T10:57:19Z")
How do you end up with a clear app.js ?
I'm stuck with an app.min.js, unreadable, hence can't debug any error popping up.... ☹