| SAMPLE-1 : | 11:50 | ▄ | ▄ | ▄ | ▄ | ▄ | ▄ | ▄ | ▄ | ▄ | ▄ | 11:40 | ▄ | ▄ | ▄ | ▄ | ▄ | ▄ | ▄ | ▄ | ▄ | ▄ | 11:30 | ▄ | ▄ | ▄ | ▄ | ▄ | ▄ | ▄ | ▄ | ▄ | ▄ | ","payloadType":"str","x":3450,"y":1250,"wires":[["f47e7012dc1e56bb"]]},{"id":"422c63c25531cb58","type":"ui_group","name":"TABLE","tab":"5e0dd10e66fdea95","order":1,"disp":false,"width":"30","collapse":false,"className":""},{"id":"5e0dd10e66fdea95","type":"ui_tab","name":"TRAIL","icon":"dashboard","order":8,"disabled":false,"hidden":false}]
```


changing size 30x2 also still gives scroll bar, it only goes after i change it to 30x5, but by this, I loose lot of _real estate_ on the dashboard.

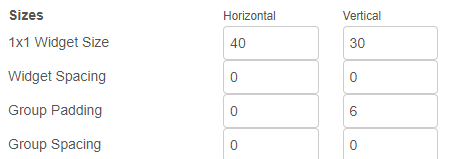
my site dimensions are like below
---
**Author:**  [@TotallyInformation](https://discourse.nodered.org/u/TotallyInformation)\
**Post date:** [13 July 2024 10:49 UTC](https://discourse.nodered.org/t/ui-template-html-table-how-to-adjust-the-height-to-desired-height/89460/2 "2024-07-13T10:49:10Z")
Quick question: Why put that in a table?
Also, do you REALLY need to allow IE8 as your styles suggest?
You also have rather ancient attributes in your table anyway and so may be mixing attributes and styles to control the layout which is rarely a good thing unless you REALLY need browser support going back to the dark ages! 🙂
---
**Author:**  [@smanjunath211](https://discourse.nodered.org/u/smanjunath211)\
**Post date:** [13 July 2024 12:40 UTC](https://discourse.nodered.org/t/ui-template-html-table-how-to-adjust-the-height-to-desired-height/89460/3 "2024-07-13T12:40:03Z")
> [@TotallyInformation](#):
>
> Why put that in a table
I dont know any other way?
I am trying to get something similar to ui-state trail. to show the status of machine on a bar.
> [@TotallyInformation](#):
>
> do you REALLY need to allow IE8
> [@TotallyInformation](#):
>
> ancient attributes
i dont even know what that means, i am just browsing internet and trying my luck to get it as per my liking.
would love if you point to me in right direction. i have 20 lines which i want to show their status, so using table to use each row as one machine status line.

---
**Author:**  [@TotallyInformation](https://discourse.nodered.org/u/TotallyInformation)\
**Post date:** [13 July 2024 16:38 UTC](https://discourse.nodered.org/t/ui-template-html-table-how-to-adjust-the-height-to-desired-height/89460/4 "2024-07-13T16:38:43Z")
> [@smanjunath211](#):
>
> would love if you point to me in right direction. i have 20 lines which i want to show their status, so using table to use each row as one machine status line.
OK, I didn't pick up that you needed multiple lines of output.
As the author of UIBUILDER, I don't really use Dashboard except for really simple things. So I might not be the best person to help with this.
Unless you can find a chart library that can output something like this, I don't think what you are trying to do is especially simple, especially if you don't have any web skills. But it would be significantly more complex without Node-RED - EXCEPT for 1 exception and that would be to use Grafana with a suitable data source. Grafana already has heatmaps, wouldn't look quite the same probably but you might get close. Even that though isn't especially easy to achieve.
Coming back to the problem at hand though. You should remove `border='0' cellpadding="0"` from the table entry and `width="120px" height="1px" align="left"` from the `tr` (which defines a row).
Next immediate issue is that you haven't closed off the `tr` or the `table` tags. So the browser will be struggling to understand what is happening.
Next up is working out how to make your data dynamic rather than, as it currently is, static.
_Are the number of devices (rows) static_? Or do you get a different number or rows from time-to-time - and if so, how often.
You basically have a couple of choices here. Either rebuild the HTML table each time you do an update (which looks to be once a minute?) or get the browser to rebuild the table. Hard to say which is best because it somewhat depends on how many rows you will have and how relatively powerful/congested your server and clients are respectively.
So, some additional things for you to think about and come back with answers. Then we can look for actual answers.
---
**Author:**  [@smanjunath211](https://discourse.nodered.org/u/smanjunath211)\
**Post date:** [14 July 2024 02:54 UTC](https://discourse.nodered.org/t/ui-template-html-table-how-to-adjust-the-height-to-desired-height/89460/5 "2024-07-14T02:54:26Z")
> [@TotallyInformation](#):
>
> use Grafana
I have been there, but unfortunately, the help forum is almost non-responsive and difficult to get through if there are any roadblocks.
> [@TotallyInformation](#):
>
> closed off the `tr` or the `table` tags
I noticed that and have already rectified, but it didn't have any effect. (was working fine without it too)
> [@TotallyInformation](#):
>
> make your data dynamic
It is dynamic, (the data flows in with a mysql query set to run every minute) if that is what you mean. have posted a static data for demo purpose.
> [@TotallyInformation](#):
>
> _number of devices (rows) static_?
yes, they are. it will increase if we add another brand new packing line.
> [@TotallyInformation](#):
>
> looks to be once a minute?
Yes, data update happens every minute at the stroke of 00.
> [@TotallyInformation](#):
>
> rebuild the HTML table each time
this is what i am comfortable with, as i dont know how to tackle this otherwise.
AFTERTHOUGHT:
the problem of extra height of the template in the dashboard, is not a great issue, once I have 20 lines, as the 'extra padding' i am getting is constant for 1 line or 20 lines. i think i can live with it.
However, i would still need guidance to simplify my flow if there is a chance.
> [@TotallyInformation](#):
>
> author of UIBUILDER,
I am following you since very long, but honestly didn't try to use it as dashboard 1 was serving my requirement, but as i keep learning and see the possibilities, i would definitely look into UIBUILDER or dashboard-2. if DB2 had `node-red-contrib-ui-state-trail` by @hotNipi i would have easily switched over by now.
---
**Author:**  [@arturv2000](https://discourse.nodered.org/u/arturv2000)\
**Post date:** [14 July 2024 09:58 UTC](https://discourse.nodered.org/t/ui-template-html-table-how-to-adjust-the-height-to-desired-height/89460/6 "2024-07-14T09:58:16Z")
Check this git comment:
>
>
> \### Current Behavior
>
> I'm trying to plot a single integer value from an MQTT nod…e in a chart with these settings:
>
> \* Append
> \* Line Style
> \* Point Style set to None
> \* Latest 15 seconds or at most 200 points
>
> Plotting works, but it is unbearably slow/intense on the rendering engine. I added a delay node to rate limit incoming data to 5 points/seconds (would prefer to go up to at least 10) but I'm still almost hitting 100% CPU usage. Rate limiting is set to drop intermediate messages.
>
> \### Expected Behavior
>
> CPU usage should not be that high. To me it looks like adding new points and adjusting time labels take an awful lot of time. Rendering looks to be pretty ok:
>
> !\[slow\_render\](https://github.com/FlowFuse/node-red-dashboard/assets/5982179/48bfe3d8-0b7b-4dd8-94f9-20e5eab7a7e8)
>
> \### Steps To Reproduce
>
> A version of my flow:
>
> \`\`\`json
> \[{"id":"a0c4ab0bbd5622e1","type":"mqtt in","z":"c2e9349180cc114d","name":"Incoming value","topic":"signals/my\_value","qos":"2","datatype":"auto-detect","broker":"a32ce2ad7015ac8d","nl":false,"rap":true,"rh":0,"inputs":0,"x":320,"y":580,"wires":\[\["d6196e04e9c97295"\]\]},{"id":"d6196e04e9c97295","type":"delay","z":"c2e9349180cc114d","name":"","pauseType":"rate","timeout":"5","timeoutUnits":"milliseconds","rate":"5","nbRateUnits":"1","rateUnits":"second","randomFirst":"1","randomLast":"5","randomUnits":"seconds","drop":true,"allowrate":false,"outputs":1,"x":600,"y":580,"wires":\[\["dac43467a8dc873a"\]\]},{"id":"dac43467a8dc873a","type":"ui-chart","z":"c2e9349180cc114d","group":"dddb49f16fb95d13","name":"","label":"Value chart","order":3,"chartType":"line","category":"topic","categoryType":"msg","xAxisProperty":"","xAxisPropertyType":"msg","xAxisType":"time","yAxisProperty":"","ymin":"-180","ymax":"180","action":"append","pointShape":"false","pointRadius":4,"showLegend":true,"removeOlder":"15","removeOlderUnit":"1","removeOlderPoints":"200","colors":\["#1f77b4","#aec7e8","#ff7f0e","#2ca02c","#98df8a","#d62728","#ff9896","#9467bd","#c5b0d5"\],"width":"27","height":8,"className":"","x":830,"y":580,"wires":\[\[\]\]},{"id":"a32ce2ad7015ac8d","type":"mqtt-broker","name":"mqtt","broker":"mqtt","port":"1883","clientid":"nodered","autoConnect":true,"usetls":false,"protocolVersion":"4","keepalive":"60","cleansession":false,"autoUnsubscribe":true,"birthTopic":"","birthQos":"0","birthRetain":"false","birthPayload":"","birthMsg":{},"closeTopic":"","closeQos":"0","closeRetain":"false","closePayload":"","closeMsg":{},"willTopic":"","willQos":"0","willRetain":"false","willPayload":"","willMsg":{},"userProps":"","sessionExpiry":""},{"id":"dddb49f16fb95d13","type":"ui-group","name":"Information","page":"341daee243fdb851","width":"27","height":"1","order":-1,"showTitle":true,"className":"","visible":"true","disabled":"false"},{"id":"341daee243fdb851","type":"ui-page","name":"Sensors","ui":"ea6622fbd539b85d","path":"/sensors","icon":"monitor","layout":"grid","theme":"67f28c895c273935","order":4,"className":"","visible":"true","disabled":"false"},{"id":"ea6622fbd539b85d","type":"ui-base","name":"Dashboard","path":"/dashboard","includeClientData":true,"acceptsClientConfig":\["ui-notification","ui-control"\],"showPathInSidebar":false,"navigationStyle":"icon"},{"id":"67f28c895c273935","type":"ui-theme","name":"Autoliv","colors":{"surface":"#141991","primary":"#00427a","bgPage":"#9d9d9d","groupBg":"#ffffff","groupOutline":"#cccccc"},"sizes":{"pagePadding":"12px","groupGap":"12px","groupBorderRadius":"4px","widgetGap":"12px"}}\]
> \`\`\`
>
> \### Environment
>
> \- Dashboard version: 1.3.0
> \- Node-RED version: 3.1.6
> \- Node.js version: 16.20.2
> \- npm version: 8.19.4
> \- Platform/OS: Linux Lite 6.6
> \- Browser: Chrome Version 122.0.6261.57 (Official Build) (64-bit)
>
> I'm running Node-RED in a container with an official image (https://hub.docker.com/layers/nodered/node-red/latest/images/sha256-867a225c65ed6364e7e88a788b9ac54711544cd1af94c488f7954f880104d61a?context=explore),
>
>
> \### Have you provided an initial effort estimate for this issue?
>
> I am not a FlowFuse team member
There is a link to [example](https://codepen.io/Steve-Mcl/pen/dyEBeZy) on doing something similar to state trail using echarts, don't know how customizable that is, but seems doable using `ui-template` even in DB1.
---
**Author:**  [@TotallyInformation](https://discourse.nodered.org/u/TotallyInformation)\
**Post date:** [14 July 2024 10:40 UTC](https://discourse.nodered.org/t/ui-template-html-table-how-to-adjust-the-height-to-desired-height/89460/7 "2024-07-14T10:40:02Z")
Thanks for the replies.
If I were to use Dashboard 2.0 or UIBUILDER with VueJS, I would simply send the data to the front-end and get VueJS to build the table. But that means learning Vue.
Without Vue or similar, I would use UIBUILDER's low-code capability. Converting the SQL output into something that the browser outputs as the table. Here is an example of something I quickly knocked up for work.

This is just a segment of the code to give you a feel for how the low-code JSON output is built, not a complete example.
```auto
/** Each group/treatment has a list of apps
* @param {string} groupName Name of the current group
* @param {string} treatName Name of the current treatment
* @param {*} msg Data to process
* @returns {Array} a _ui components array
*/
listAppsInGroup: function listAppsInGroup(groupName, treatName, msg) {
const grouped = msg.grouped
const treatment = grouped[groupName][treatName] ? grouped[groupName][treatName] : []
const out = []
treatment.forEach(app => {
const maturity = app.maturity ? app.maturity : '-'
const vis = app.visibility ? app.visibility : '-'
const org = app.org ? app.org : '-'
out.push({
type: 'li',
attributes: {
'class': 'flex box surface4',
style: `color: ${tColours[treatName]}`,
},
components: [
// {
// type: 'div',
// attributes: {
// class: 'status-side-panel'
// },
// },
{
type: 'div',
attributes: {},
components: [
{
type: 'details',
components: [
{
type: 'summary',
attributes: {
style: 'list-style-type: none;'
},
slot: app.name,
},
{
type: 'div',
attributes: {
style: 'font-size: smaller; color: var(--text1);'
},
slot: app.desc,
},
{
type: 'div',
attributes: {
style: 'font-size: smaller; color: var(--text2);'
},
slot: `${maturity.slice(0, 1).toUpperCase()} ${vis.slice(0, 1).toUpperCase()} ${org.toUpperCase()}`,
},
],
},
],
},
],
})
})
return out
},
```
Because I knocked it up quickly, it has lots of manual styles in there but really, it should have only used class names.
Note that you could also use the same approach to build the HTML and send it to either of the Dashboard's because UIBUILDER is able to do the conversion from low-code to HTML in Node-RED using the `uib-html` node.
The advantage of using UIBUILDER low-code is that it is very close to HTML so learning to do it in low-code is a good stepping stone to building something that outputs HTML in the future. Of course, whether that is important to you is something only you can decide.
Using UIBUILDER would also make it easy enough for you to write some front-end JS to build the table from data sent from Node-RED. This is the "traditional" way to use UIBUILDER. The front-end library makes it trivial to listen for messages from NR and gives a few helpers such as `$(cssSelector)` to get a reference to an element on the page. Using this method means that you will be building directly on your existing knowledge of HTML and JS.
* * *
By the way, thought of another approach if you are happy building HTML. You could also use the core `template` node with Mustache. You feed the SQL output to the template and it builds the HTML which you can send to a `ui_template` node.
You can also use the same method with UIBUILDER if you like. The `uib-element` node has an `html` element type so just send the output of the `template` node through the `uib-element` node and straight on to the `uibuilder` node. Job done. UIBUILDER has a built-in example for this:

The example doesn't do a lot but the number changes every time you trigger the flow:

* * *
As always with Node-RED, lots of options to choose from. 😀
* * *
PS: Remembered another example. My home dashboard has a number of pages but this is an extract - it shows the status of some of the services I have running:

Here is the most important part of the flow that builds the whole SPA, not just the section shown:
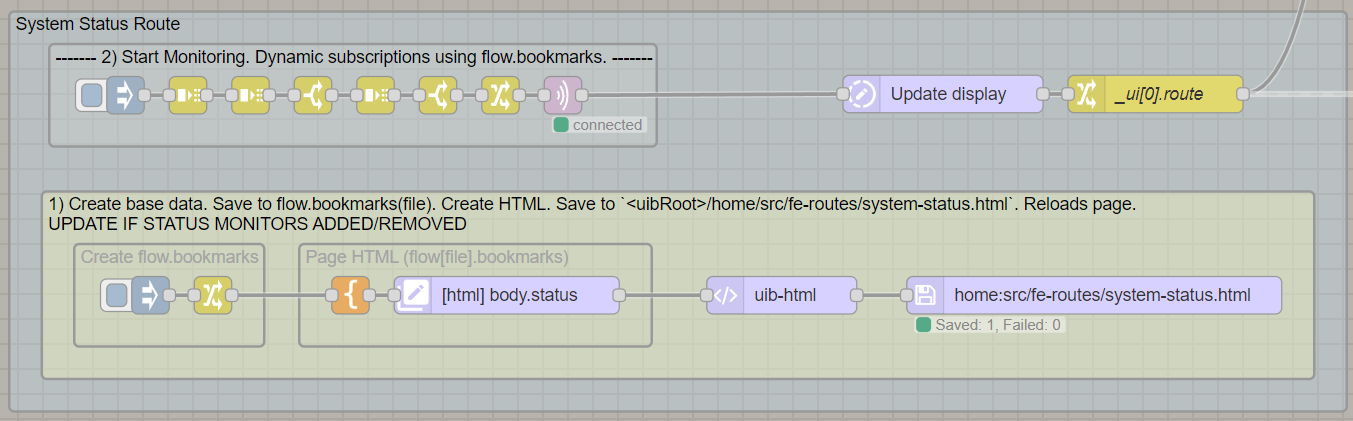
Here I use a mix-and-match approach where the core page is built using a template (the lower part of the flow) and other parts built dynamically (the upper part).
With newer versions of UIBUILDER, I would actually build and save the HTML for the core page layout so that it was static. Naturally, uibuilder has the `uib-html` and `uib-save` nodes to make that easy.
---
**Author:**  [@system](https://discourse.nodered.org/u/system)\
**Post date:** [13 August 2024 10:40 UTC](https://discourse.nodered.org/t/ui-template-html-table-how-to-adjust-the-height-to-desired-height/89460/8 "2024-08-13T10:40:55Z")
This topic was automatically closed 30 days after the last reply. New replies are no longer allowed.
|---|