I have tried for hours to get this to work, i want to plot 2 temperatures from an array
I even tried AI which sent me down a ridiculous path !!!
I am using Dasboard 1
My array that comes into Node-RED from 2 sensors
{"DS1820":[{"heating":false,"temperature":25.8,"target":-1,"hysteresis":0.2},{"N/A":false,"temperature":26.4,"target":-1,"hysteresis":0.2}]}
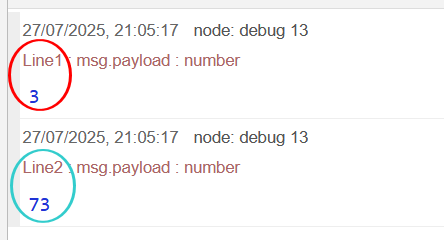
I have this flow that works as an example for random numbers but cannot get it to work with the above. I have tried many ways but I am out of my depth ![]()
[{"id":"810330e445c1b1a6","type":"inject","z":"37097d1320355ac2","name":"Trigger Snapshot","props":[{"p":"payload"}],"repeat":"","crontab":"","once":false,"onceDelay":0.1,"topic":"","payload":"","payloadType":"date","x":1150,"y":2650,"wires":[["2df365f379c533a8"]]},{"id":"702e7c62e3581e42","type":"ui_chart","z":"37097d1320355ac2","name":"Sensor Chart","group":"622657530a0d7963","order":0,"width":"0","height":"0","label":"Sensor Temperatures","chartType":"line","legend":"true","xformat":"HH:mm:ss","nodata":"","dot":true,"ymin":"","ymax":"","removeOlder":"10","removeOlderPoints":"","removeOlderUnit":"60","cutout":"","useOneColor":false,"useUTC":false,"colors":["#1f77b4","#aec7e8","#ff7f0e","#2ca02c","#98df8a","#d62728","#ff9896","#9467bd","#c5b0d5"],"outputs":1,"useDifferentColor":false,"className":"","x":1170,"y":2760,"wires":[["af4a38f86160c9f3"]]},{"id":"af4a38f86160c9f3","type":"debug","z":"37097d1320355ac2","name":"Debug Output","active":true,"tosidebar":true,"console":false,"tostatus":false,"complete":"payload","targetType":"msg","x":1170,"y":2820,"wires":[]},{"id":"2df365f379c533a8","type":"function","z":"37097d1320355ac2","name":"Generate Data","func":"var msg = {};\nvar msg1 = {};\nmsg.payload = Math.round(Math.random()*100);;\nmsg.topic = 'Line1';\nmsg1.payload = Math.round(Math.random()*100);\nmsg1.topic = 'Line2';\nreturn [msg, msg1];","outputs":2,"timeout":"","noerr":0,"initialize":"","finalize":"","libs":[],"x":1170,"y":2710,"wires":[["702e7c62e3581e42"],["702e7c62e3581e42"]]},{"id":"622657530a0d7963","type":"ui_group","name":"Charts","tab":"2cf3f4e5d086e667","order":1,"disp":true,"width":"25","collapse":false,"className":""},{"id":"2cf3f4e5d086e667","type":"ui_tab","name":"Charts","icon":"dashboard","order":4,"disabled":false,"hidden":false}]
Thanks