D3 Library and the Template Node

I am learning to use D3 to build charts and want to use the Template Node to add the results to my Node-Red Dashboard.

Here is a screenshot of the dashboard. Note, the html text is inside the Node-Red Dashboard group box, upper right. However, the D3 text and SVG circle is outside the Node-Red Dashboard Box, lower left.

What am I missing to place the D3 elements inside the Node-Red Dashboard Box?

Here is the HTML code:

<!DOCTYPE html>
<html <html>

<head>

    <title>d3 Learning</title>
    <script src="http://d3js.org/d3.v3.min.js" charset="utf-8"></script>

</head>

<body>

><p>This Is Text Text</p>


    ><script>

        // D3 text

        d3
        .select('body')  
        .append('p') 
        .text('hello alan')
        .style("color", "red")

        // SVG Box

        var canvas = d3
        .select("body")
        .append("svg")
        .attr("width", 200)
        .attr("height", 100)

        //SVG Circle

        var circle = canvas
        .append("circle")
        .attr("cx", 100)
        .attr("cy", 50)
        .attr("r", 50)
        .attr("fill", "red")


    </script>


</body>


</html>

While not the answer to your problem, the ui-template node should not contain html or head or body (since the template is injected into the dashboard HTML BODY)

As for your issue, you will likely need to read up on D3 and how to target a specific element (the element created by the template node)

Thanks, Steve.

Hey, are you the same as the QRZ.com software engineer? If so, I sent a ham radio message to your qrz.com email address.

Alan

No, not me :slight_smile:

Steve and the group, another D3 related question.

Can I use D3 within the SVG Node? Can I add a "head" for referencing the D3 library, on the SVG tab? Or use an external template node, with the D3 library reference, on the template's head?

Alan

Thats not really how things work.

You can certainly add D3 to a <script> element in a ui-template node to target the SVG element that the SVG node generates to manipulate its state.

Have you tried to search for examples or threads about using d3.js? I know I have shared at least one. Dashboard tips. Value with area chart using d3.js

Maybe it helps a bit

1 Like

Thanks, hotNipi

This is what I was hoping to find. Lots of learning from your flow.

Alan

Another question:

By accident, I found I did not need to add a D3 library link, when using the Template Node. Using the Safari browser inspector, I verified there was not a D3 link in the head section.....and, D3 was working just fine.

Q- Is the D3 library now built into Node-Red v2.2.1?

Alan

It is. But In my flow the version of the d3 is higher. There will be syntax difference if you use old version and some of features are not supported

Ready for another question.

I have made my first D3, Template Node "Bar Graph" flow. I am assigning the values from array, "dataArray" to the width and color of rectangles. I am adding a d3 scale and colors based on the range of values in the array. Lots of good learning.

I am stuck on how to dynamically change the value of "dataArray" from outside the template node.

Here is a screenshot of the variable "dataArray", from inside the D2 Script:

And here is a screenshot of the Dashboard:

In my flow, I have an inject node with msg.payload = an Array of numbers.

Q- how do I make "var dataArray = msg.payload". Here is a screenshot of what I tried, without success. I also tried "var dataArray = {{msg.payload}}, without success:

Here is the flow:

[
    {
        "id": "7213e6b276ca6730",
        "type": "tab",
        "label": "Bar Chart",
        "disabled": false,
        "info": "",
        "env": []
    },
    {
        "id": "44ec20834592ad1f",
        "type": "ui_template",
        "z": "7213e6b276ca6730",
        "group": "68aac522c027a8e4",
        "name": "Chart",
        "order": 0,
        "width": "6",
        "height": "4",
        "format": "<body>\n\n\n><p> Text Outside of the Scirpt </p>\n\n    <script>\n\n        \n        var dataArray = [20,30, 40, 90, 50, 100,300, 200]\n\n        var max = d3.max(dataArray)\n        var count = d3.set(dataArray).size()\n\n        var count = dataArray.length\n\n\n\n        var width = 500\n        var height = (count * 100) + 100\n\n        console.log(height)\n\n        var widthScale = d3.scale.linear()\n                            .domain([0, max + 20])\n                            .range([0, width])\n\n\n        var color = d3.scale.linear()\n                            .domain([0, max])\n                            .range([\"red\", \"blue\"])\n\n        var axis = d3.svg.axis()\n                        .scale(widthScale)\n                        .ticks(5)\n\n\n\n        // SVG Container\n\n        var canvas = d3\n            .select(\"body\")\n            .append(\"svg\")    \n            .attr(\"width\", width)\n            .attr(\"height\", height)\n            .append(\"g\")\n            .attr(\"transform\", \"translate(50,0)\")\n            // .call(axis)\n\n\n        // Create Bars\n\n            var bars = canvas .selectAll(\"rect\")\n            .data(dataArray)\n            .enter()\n                .append(\"rect\")\n                // .attr(\"width\", function(d){return d * 10})\n                .attr(\"width\", function(d){return widthScale(d)})\n\n                .attr(\"height\", 50)\n\n                .attr(\"y\", function(d, i){return i * 100})\n\n                .attr(\"fill\", color)\n\n        // Move Axis\n\n             var move = height - 100\n\n            // var move = 600\n\n                canvas.append(\"g\")\n                    .attr(\"transform\", \"translate(0,\" + move + \")\")\n                    .call(axis)\n\n\n    </script>\n\n\n\n</body>\n\n\n\n\n</html>",
        "storeOutMessages": true,
        "fwdInMessages": true,
        "resendOnRefresh": true,
        "templateScope": "local",
        "className": "",
        "x": 550,
        "y": 240,
        "wires": [
            []
        ]
    },
    {
        "id": "2966ae5f64f1964c",
        "type": "inject",
        "z": "7213e6b276ca6730",
        "name": "",
        "props": [
            {
                "p": "payload"
            }
        ],
        "repeat": "",
        "crontab": "",
        "once": false,
        "onceDelay": 0.1,
        "topic": "",
        "payload": "[20,30,50]",
        "payloadType": "json",
        "x": 270,
        "y": 260,
        "wires": [
            [
                "44ec20834592ad1f",
                "bdb09ceab5e5f3f4"
            ]
        ]
    },
    {
        "id": "bdb09ceab5e5f3f4",
        "type": "debug",
        "z": "7213e6b276ca6730",
        "name": "",
        "active": true,
        "tosidebar": true,
        "console": false,
        "tostatus": false,
        "complete": "payload",
        "targetType": "msg",
        "statusVal": "",
        "statusType": "auto",
        "x": 540,
        "y": 340,
        "wires": []
    },
    {
        "id": "68aac522c027a8e4",
        "type": "ui_group",
        "name": "Text",
        "tab": "911a0d7d34b66434",
        "order": 1,
        "disp": true,
        "width": "6",
        "collapse": false,
        "className": ""
    },
    {
        "id": "911a0d7d34b66434",
        "type": "ui_tab",
        "name": "HTML",
        "icon": "dashboard",
        "order": 1,
        "disabled": false,
        "hidden": false
    }
]

I am making progress and learning more D3 and HTML.

I was able to "attach" the D3 Bar Chart SVG to a "div" tag, with and id name, inside the html body. Doing so moves the SVG bar chart inside the Dashboard view box.....good. Thanks Steve.

Need help: I am still unable to bind the external "msg.payload array" to the D3 Script "var dataArray". Any help here is appreciated.

Here is a screenshot of the cleaned up bar chart inside the Template Node's View Box (note: I cannot figure out how to remove the extra ">>" on the top of the SVG bar chart):

Here is the revised flow:

[
    {
        "id": "016dbc715629d328",
        "type": "tab",
        "label": "Bar Chart",
        "disabled": false,
        "info": "",
        "env": []
    },
    {
        "id": "1a026a3e84a63aa6",
        "type": "ui_template",
        "z": "016dbc715629d328",
        "group": "68aac522c027a8e4",
        "name": "Chart",
        "order": 0,
        "width": "11",
        "height": "8",
        "format": "><style>\n    #chart {\n        background-color: #f5f2e9;\n        width: 600px;\n    }\n</style>\n\n<body>\n\n    <!-- ><h1 class=\"title\"> Bar Chart </h1> -->\n    \n    ><div id=\"chart\"></div>\n\n\n    <script>\n        var dataArray = [20,400, 150, 300, 500, 100]\n\n        var max = d3.max(dataArray)\n\n        var count = dataArray.length\n\n        var barHeight = 35\n        var barOffset = 5\n\n\n\n        var width = 500\n        var height = (count * (barHeight + barOffset)) + 100\n\n        console.log(height)\n\n        var widthScale = d3.scale.linear()\n                            .domain([0, max + 20])\n                            .range([0, width])\n\n\n        var color = d3.scale.linear()\n                            .domain([0, max])\n                            .range([\"red\", \"blue\"])\n\n        var axis = d3.svg.axis()\n                        .scale(widthScale)\n                        .ticks(5)\n\n\n\n        // SVG Container\n\n        var canvas = d3\n            .select(\"#chart\")\n            .append(\"svg\")    \n            .attr(\"width\", width)\n            .attr(\"height\", height)\n            .append(\"g\")\n            .attr(\"transform\", \"translate(50,50)\")\n            // .call(axis)\n\n\n        // Create Bars\n\n            var bars = canvas .selectAll(\"rect\")\n            .data(dataArray)\n            .enter()\n                .append(\"rect\")\n                // .attr(\"width\", function(d){return d * 10})\n                .attr(\"width\", function(d){return widthScale(d)})\n\n                .attr(\"height\", barHeight)\n\n                .attr(\"y\", function(d, i){return i * (barHeight + barOffset)})\n\n                .attr(\"fill\", color)\n\n        // Move Axis\n\n             var move = height - 100\n\n            // var move = 600\n\n                canvas.append(\"g\")\n                    .attr(\"transform\", \"translate(0,\" + move + \")\")\n                    .call(axis)\n\n\n    </script>\n\n</body>\n\n\n</html>",
        "storeOutMessages": true,
        "fwdInMessages": true,
        "resendOnRefresh": true,
        "templateScope": "local",
        "className": "",
        "x": 550,
        "y": 240,
        "wires": [
            []
        ]
    },
    {
        "id": "f380d3d1fb41cd3b",
        "type": "inject",
        "z": "016dbc715629d328",
        "name": "",
        "props": [
            {
                "p": "payload"
            }
        ],
        "repeat": "",
        "crontab": "",
        "once": false,
        "onceDelay": 0.1,
        "topic": "",
        "payload": "[20,30,50]",
        "payloadType": "json",
        "x": 360,
        "y": 240,
        "wires": [
            [
                "1a026a3e84a63aa6",
                "79796bc98b193fdd"
            ]
        ]
    },
    {
        "id": "79796bc98b193fdd",
        "type": "debug",
        "z": "016dbc715629d328",
        "name": "",
        "active": true,
        "tosidebar": true,
        "console": false,
        "tostatus": false,
        "complete": "payload",
        "targetType": "msg",
        "statusVal": "",
        "statusType": "auto",
        "x": 530,
        "y": 340,
        "wires": []
    },
    {
        "id": "68aac522c027a8e4",
        "type": "ui_group",
        "name": "D3 Bar Chart",
        "tab": "911a0d7d34b66434",
        "order": 1,
        "disp": true,
        "width": "11",
        "collapse": false,
        "className": ""
    },
    {
        "id": "911a0d7d34b66434",
        "type": "ui_tab",
        "name": "HTML",
        "icon": "dashboard",
        "order": 1,
        "disabled": false,
        "hidden": false
    }
]

I need help to bind Node-Red message array inside the Node-Red template Node, D3 Script.

I studied hotNipi's D3 flow and used his exact method. I split the HTML and D3 code to a separate Template Node and used a separate Template_ui Node to make the dashboard.

I then injected the "msg.data = [x,y,z]" into the template node and, in the HTML script section set "var dataArray = {{data}}" and it did not work.

What am I missing?

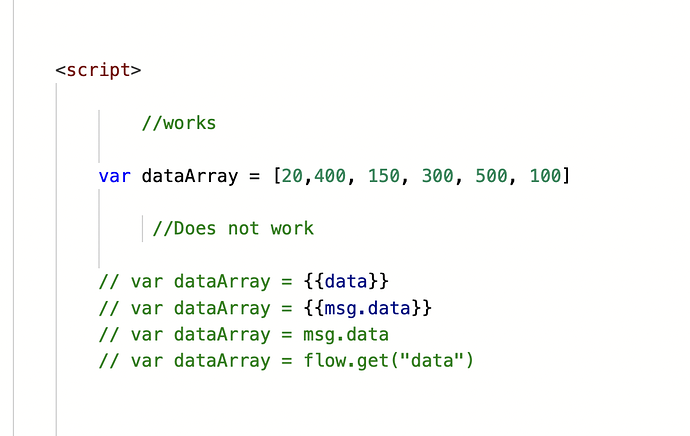
Here is a screenshot of the different attempts to build the "dataArray" variable. None of the external variations worked:

Here is the latest copy of the D2 Node-Red Test/Learning Flow:

[
    {
        "id": "016dbc715629d328",
        "type": "tab",
        "label": "Bar Chart",
        "disabled": false,
        "info": "",
        "env": []
    },
    {
        "id": "f380d3d1fb41cd3b",
        "type": "inject",
        "z": "016dbc715629d328",
        "name": "[20,400, 150, 300, 500, 100]",
        "props": [
            {
                "p": "data",
                "v": "[20,400, 150, 300, 500, 100]",
                "vt": "json"
            }
        ],
        "repeat": "",
        "crontab": "",
        "once": false,
        "onceDelay": 0.1,
        "topic": "",
        "payloadType": "str",
        "x": 300,
        "y": 340,
        "wires": [
            [
                "79796bc98b193fdd",
                "a221c92bcef3b289"
            ]
        ]
    },
    {
        "id": "79796bc98b193fdd",
        "type": "debug",
        "z": "016dbc715629d328",
        "name": "",
        "active": true,
        "tosidebar": true,
        "console": false,
        "tostatus": false,
        "complete": "true",
        "targetType": "full",
        "statusVal": "",
        "statusType": "auto",
        "x": 530,
        "y": 240,
        "wires": []
    },
    {
        "id": "1ea70636777790a9",
        "type": "change",
        "z": "016dbc715629d328",
        "name": "",
        "rules": [
            {
                "t": "set",
                "p": "data",
                "pt": "flow",
                "to": "payload",
                "tot": "msg"
            }
        ],
        "action": "",
        "property": "",
        "from": "",
        "to": "",
        "reg": false,
        "x": 570,
        "y": 100,
        "wires": [
            []
        ]
    },
    {
        "id": "cd2182c9f42c99b3",
        "type": "inject",
        "z": "016dbc715629d328",
        "name": "[20,400, 150, 300, 500, 100]",
        "props": [
            {
                "p": "payload"
            }
        ],
        "repeat": "",
        "crontab": "",
        "once": false,
        "onceDelay": 0.1,
        "topic": "",
        "payload": "[20,400, 150, 300, 500, 100]",
        "payloadType": "json",
        "x": 300,
        "y": 100,
        "wires": [
            [
                "1ea70636777790a9"
            ]
        ]
    },
    {
        "id": "a221c92bcef3b289",
        "type": "template",
        "z": "016dbc715629d328",
        "name": "",
        "field": "template",
        "fieldType": "msg",
        "format": "handlebars",
        "syntax": "mustache",
        "template": "<style>\n    #chart {\n        background-color: #f5f2e9;\n        width: 600px;\n    }\n</style>\n\n<body>\n\n    <h1 class=\"title\"> Bar Chart </h1>\n    \n    <div id=\"chart\"></div>\n\n\n    <script>\n        \n            //works\n        \n        var dataArray = [20,400, 150, 300, 500, 100]\n\n             //Does not work\n\n        // var dataArray = {{data}}\n        // var dataArray = {{msg.data}}\n        // var dataArray = msg.data\n        // var dataArray = flow.get(\"data\")\n\n\n\n        var max = d3.max(dataArray)\n\n        var count = dataArray.length\n\n        var barHeight = 35\n        var barOffset = 5\n\n\n\n        var width = 500\n        var height = (count * (barHeight + barOffset)) + 100\n\n        console.log(height)\n\n        var widthScale = d3.scale.linear()\n                            .domain([0, max + 20])\n                            .range([0, width])\n\n\n        var color = d3.scale.linear()\n                            .domain([0, max])\n                            .range([\"red\", \"blue\"])\n\n        var axis = d3.svg.axis()\n                        .scale(widthScale)\n                        .ticks(5)\n\n\n\n        // SVG Container\n\n        var canvas = d3\n            .select(\"#chart\")\n            .append(\"svg\")    \n            .attr(\"width\", width)\n            .attr(\"height\", height)\n            .append(\"g\")\n            .attr(\"transform\", \"translate(50,50)\")\n            // .call(axis)\n\n\n        // Create Bars\n\n            var bars = canvas .selectAll(\"rect\")\n            .data(dataArray)\n            .enter()\n                .append(\"rect\")\n                // .attr(\"width\", function(d){return d * 10})\n                .attr(\"width\", function(d){return widthScale(d)})\n\n                .attr(\"height\", barHeight)\n\n                .attr(\"y\", function(d, i){return i * (barHeight + barOffset)})\n\n                .attr(\"fill\", color)\n\n        // Move Axis\n\n             var move = height - 100\n\n            // var move = 600\n\n                canvas.append(\"g\")\n                    .attr(\"transform\", \"translate(0,\" + move + \")\")\n                    .call(axis)\n\n\n    </script>\n\n</body>\n\n\n</html>",
        "output": "str",
        "x": 580,
        "y": 340,
        "wires": [
            [
                "d7543741758a8c67"
            ]
        ]
    },
    {
        "id": "d7543741758a8c67",
        "type": "ui_template",
        "z": "016dbc715629d328",
        "group": "68aac522c027a8e4",
        "name": "template",
        "order": 1,
        "width": "11",
        "height": "9",
        "format": "",
        "storeOutMessages": true,
        "fwdInMessages": true,
        "resendOnRefresh": true,
        "templateScope": "local",
        "className": "",
        "x": 760,
        "y": 340,
        "wires": [
            []
        ]
    },
    {
        "id": "68aac522c027a8e4",
        "type": "ui_group",
        "name": "D3 Bar Chart",
        "tab": "911a0d7d34b66434",
        "order": 1,
        "disp": true,
        "width": "11",
        "collapse": false,
        "className": ""
    },
    {
        "id": "911a0d7d34b66434",
        "type": "ui_tab",
        "name": "HTML",
        "icon": "dashboard",
        "order": 1,
        "disabled": false,
        "hidden": false
    }
]

Alan

You need to pass the msg.data into the template as a string not an object/array. You can either use a json node and convert to a string or do it in a function node.
e.g.

[{"id":"f380d3d1fb41cd3b","type":"inject","z":"016dbc715629d328","name":"[20,400, 150, 300, 500, 100]","props":[{"p":"data","v":"[20,400, 150, 300, 500, 100]","vt":"json"}],"repeat":"","crontab":"","once":false,"onceDelay":0.1,"topic":"","payloadType":"str","x":300,"y":340,"wires":[["ec768202.00d54","9644f884.05ced"]]},{"id":"ec768202.00d54","type":"json","z":"016dbc715629d328","name":"","property":"data","action":"","pretty":false,"x":440,"y":300,"wires":[["a221c92bcef3b289"]]},{"id":"9644f884.05ced","type":"function","z":"016dbc715629d328","name":"","func":"msg.data = JSON.stringify(msg.data);\nmsg.template = `<style>\n    #chart {\n        background-color: #f5f2e9;\n        width: 600px;\n    }\n</style>\n\n<body>\n\n    <h1 class=\"title\"> Bar Chart </h1>\n    \n    <div id=\"chart\"></div>\n\n\n    <script>\n        \n            //works\n        \n        var dataArray = ${msg.data}\n\n             //Does not work\n\n        // var dataArray = {{data}}\n        // var dataArray = {{msg.data}}\n        // var dataArray = msg.data\n        // var dataArray = flow.get(\"data\")\n\n\n\n        var max = d3.max(dataArray)\n\n        var count = dataArray.length\n\n        var barHeight = 35\n        var barOffset = 5\n\n\n\n        var width = 500\n        var height = (count * (barHeight + barOffset)) + 100\n\n        console.log(height)\n\n        var widthScale = d3.scale.linear()\n                            .domain([0, max + 20])\n                            .range([0, width])\n\n\n        var color = d3.scale.linear()\n                            .domain([0, max])\n                            .range([\"red\", \"blue\"])\n\n        var axis = d3.svg.axis()\n                        .scale(widthScale)\n                        .ticks(5)\n\n\n\n        // SVG Container\n\n        var canvas = d3\n            .select(\"#chart\")\n            .append(\"svg\")    \n            .attr(\"width\", width)\n            .attr(\"height\", height)\n            .append(\"g\")\n            .attr(\"transform\", \"translate(50,50)\")\n            // .call(axis)\n\n\n        // Create Bars\n\n            var bars = canvas .selectAll(\"rect\")\n            .data(dataArray)\n            .enter()\n                .append(\"rect\")\n                // .attr(\"width\", function(d){return d * 10})\n                .attr(\"width\", function(d){return widthScale(d)})\n\n                .attr(\"height\", barHeight)\n\n                .attr(\"y\", function(d, i){return i * (barHeight + barOffset)})\n\n                .attr(\"fill\", color)\n\n        // Move Axis\n\n             var move = height - 100\n\n            // var move = 600\n\n                canvas.append(\"g\")\n                    .attr(\"transform\", \"translate(0,\" + move + \")\")\n                    .call(axis)\n\n\n    </script>\n\n</body>\n\n\n</html>`\nreturn msg;","outputs":1,"noerr":0,"initialize":"","finalize":"","libs":[],"x":590,"y":380,"wires":[["7a4f627b.b9ef04"]]},{"id":"a221c92bcef3b289","type":"template","z":"016dbc715629d328","name":"","field":"template","fieldType":"msg","format":"handlebars","syntax":"mustache","template":"<style>\n    #chart {\n        background-color: #f5f2e9;\n        width: 600px;\n    }\n</style>\n\n<body>\n\n    <h1 class=\"title\"> Bar Chart </h1>\n    \n    <div id=\"chart\"></div>\n\n\n    <script>\n        \n            //works\n        \n        var dataArray = {{{data}}}\n\n             //Does not work\n\n        // var dataArray = {{data}}\n        // var dataArray = {{msg.data}}\n        // var dataArray = msg.data\n        // var dataArray = flow.get(\"data\")\n\n\n\n        var max = d3.max(dataArray)\n\n        var count = dataArray.length\n\n        var barHeight = 35\n        var barOffset = 5\n\n\n\n        var width = 500\n        var height = (count * (barHeight + barOffset)) + 100\n\n        console.log(height)\n\n        var widthScale = d3.scale.linear()\n                            .domain([0, max + 20])\n                            .range([0, width])\n\n\n        var color = d3.scale.linear()\n                            .domain([0, max])\n                            .range([\"red\", \"blue\"])\n\n        var axis = d3.svg.axis()\n                        .scale(widthScale)\n                        .ticks(5)\n\n\n\n        // SVG Container\n\n        var canvas = d3\n            .select(\"#chart\")\n            .append(\"svg\")    \n            .attr(\"width\", width)\n            .attr(\"height\", height)\n            .append(\"g\")\n            .attr(\"transform\", \"translate(50,50)\")\n            // .call(axis)\n\n\n        // Create Bars\n\n            var bars = canvas .selectAll(\"rect\")\n            .data(dataArray)\n            .enter()\n                .append(\"rect\")\n                // .attr(\"width\", function(d){return d * 10})\n                .attr(\"width\", function(d){return widthScale(d)})\n\n                .attr(\"height\", barHeight)\n\n                .attr(\"y\", function(d, i){return i * (barHeight + barOffset)})\n\n                .attr(\"fill\", color)\n\n        // Move Axis\n\n             var move = height - 100\n\n            // var move = 600\n\n                canvas.append(\"g\")\n                    .attr(\"transform\", \"translate(0,\" + move + \")\")\n                    .call(axis)\n\n\n    </script>\n\n</body>\n\n\n</html>","output":"str","x":630,"y":280,"wires":[["d7543741758a8c67","79796bc98b193fdd"]]},{"id":"7a4f627b.b9ef04","type":"ui_template","z":"016dbc715629d328","group":"68aac522c027a8e4","name":"template","order":1,"width":"11","height":"9","format":"","storeOutMessages":true,"fwdInMessages":true,"resendOnRefresh":true,"templateScope":"local","className":"","x":750,"y":400,"wires":[[]]},{"id":"d7543741758a8c67","type":"ui_template","z":"016dbc715629d328","group":"68aac522c027a8e4","name":"template","order":1,"width":"11","height":"9","format":"","storeOutMessages":true,"fwdInMessages":true,"resendOnRefresh":true,"templateScope":"local","className":"","x":760,"y":340,"wires":[[]]},{"id":"79796bc98b193fdd","type":"debug","z":"016dbc715629d328","name":"","active":true,"tosidebar":true,"console":false,"tostatus":false,"complete":"true","targetType":"full","statusVal":"","statusType":"auto","x":530,"y":240,"wires":[]},{"id":"68aac522c027a8e4","type":"ui_group","name":"D3 Bar Chart","tab":"911a0d7d34b66434","order":1,"disp":true,"width":"11","collapse":false,"className":""},{"id":"911a0d7d34b66434","type":"ui_tab","name":"HTML","icon":"dashboard","order":1,"disabled":false,"hidden":false}]

E1cid

Thanks a lot! Your explanation to use a string and two examples for building the "msg.template" string has opened up many doors for me.

I have a lot more to learn. Since my two questions have been addressed; How to bind the SVG result to the Dashboard View Box: Thanks, Steve, and how to bring in the msg.data array into the D3 script: Thanks E1cid, I consider this topic "solved".

Alan

This topic was automatically closed 14 days after the last reply. New replies are no longer allowed.