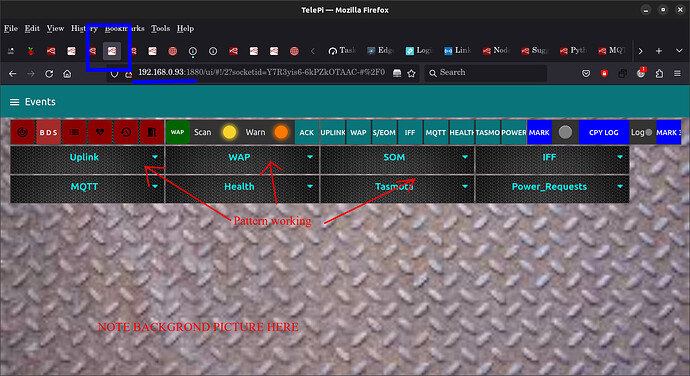
Thanks.
I've seen one problem already.
Moving on.
Machine 2, telemetry template node.
[{"id":"ad973dc.67310c","type":"ui_template","z":"c636aa5a.cc34","group":"ccfdf225.95c52","name":"Picture telemetry","order":16,"width":"0","height":"0","format":"<style>\n .centerStackedIcon {\n vertical-align: middle;\n width: 100% !important;\n }\n\n .greenText {\n color: #00ff00;\n }\n\n .redText {\n color: #ff0000;\n }\n\n .blackText {\n color: #000000;\n }\n\n\n .nr-dashboard-cardtitle {\n text-align: center;\n }\n\n body {\n background-image: url(\"/Pictures/gauges.jpg\");\n background-size: cover;\n }\n #Telemetry_Daytime mode{\n background-image: url(\"/Pictures/metal_7.jpg\");\n }\n #Telemetry_WiFi{\n background-image: url(\"/Pictures/metal_7.jpg\");\n }\n #Telemetry_Cat-5{\n background-image: url(\"/Pictures/metal_7.jpg\");\n }\n #Telemetry_WAP{\n background-image: url(\"/Pictures/metal_7.jpg\");\n }\n #Telemetry_Load monitor{\n background-image: url(\"/Pictures/metal_7.jpg\");\n }\n #Telemetry_MusicPi{\n background-image: url(\"/Pictures/metal_7.jpg\");\n }\n #Telemetry_BedPi{\n background-image: url(\"/Pictures/metal_7.jpg\");\n }\n #Telemetry_PiFace{\n background-image: url(\"/Pictures/metal_7.jpg\");\n }\n #Telemetry_EyeSpyPi{\n background-image: url(\"/Pictures/metal_7.jpg\");\n }\n #Telemetry_CameraPi{\n background-image: url(\"/Pictures/metal_7.jpg\");\n }\n #Telemetry_PortaPi{\n background-image: url(\"/Pictures/metal_7.jpg\");\n }\n #Telemetry_TelePi{\n background-image: url(\"/Pictures/metal_7.jpg\");\n }\n #Telemetry_BeefPi{\n background-image: url(\"/Pictures/metal_7.jpg\");\n }\n #Telemetry_TimePi{\n background-image: url(\"/Pictures/metal_7.jpg\");\n }\n #Telemetry_EXIT{\n background-image: url(\"/Pictures/metal_7.jpg\");\n }\n #Telemetry_DaytimeMode{\n background-image: url(\"/Pictures/metal_7.jpg\");\n }\n #Telemetry_LoadMonitor{\n background-image: url(\"/Pictures/metal_7.jpg\");\n }\n</style>\n","storeOutMessages":true,"fwdInMessages":true,"resendOnRefresh":false,"templateScope":"global","className":"","x":1060,"y":20,"wires":[[]]},{"id":"ccfdf225.95c52","type":"ui_group","name":"DaytimeMode","tab":"1c792414.600e94","order":1,"disp":false,"width":"3","collapse":false,"className":""},{"id":"1c792414.600e94","type":"ui_tab","name":"Telemetry","icon":"track_changes","order":2,"disabled":false,"hidden":false}]
The events node is set to machine health, so there's a problem.
And there is no such node for the local readings tab.
Machine 1 telemetry
[{"id":"2bfa59ce.40417e","type":"ui_template","z":"9b7e7466.a4b698","group":"b91547a3.789ea","name":"Background picture","order":9,"width":0,"height":0,"format":"<style>\n .nr-dashboard-cardtitle {\n text-align:center;\n }\n body {\n background-image: url(\"/Pictures/gauges.jpg\");\n background-size: cover;\n }\n #Telemetry_TelePi {\n background-image: url(\"/Pictures/metal_2.jpg\");\n }\n\n #Telemetry_Weather {\n background-image: url(\"/Pictures/metal_2.jpg\");\n }\n\n #Telemetry_Events {\n background-image: url(\"/Pictures/metal_2.jpg\");\n }\n\n #Telemetry_Alarms {\n background-image: url(\"/Pictures/metal_2.jpg\");\n }\n</style>","storeOutMessages":true,"fwdInMessages":true,"resendOnRefresh":false,"templateScope":"global","x":350,"y":40,"wires":[[]],"info":" #Telemetry_TelePi {\n background-image: url(\"/Pictures/metal_2.jpg\");\n }\n #Telemetry_Weather {\n background-image: url(\"/Pictures/metal_2.jpg\");\n }\n #Telemetry_Events {\n background-image: url(\"/Pictures/metal_2.jpg\");\n }\n #Telemetry_WAP status {\n background-image: url(\"/Pictures/metal_2.jpg\");\n }\n #Telemetry_Alarms {\n background-image: url(\"/Pictures/metal_2.jpg\");\n }\n #Telemetry_Show time {\n background-image: url(\"/Pictures/metal_2.jpg\");\n }\n #Telemetry_Load monitor {\n background-image: url(\"/Pictures/metal_2.jpg\");\n }\n #Telemetry_TimePi remote {\n background-image: url(\"/Pictures/metal_2.jpg\");\n }\n #Telemetry_Alarm control {\n background-image: url(\"/Pictures/metal_2.jpg\");\n }\n"},{"id":"b91547a3.789ea","type":"ui_group","z":"9b7e7466.a4b698","name":"TelePi","tab":"3245f51f.065aba","order":1,"disp":true,"width":"7","collapse":false},{"id":"3245f51f.065aba","type":"ui_tab","name":"Telemetry","icon":"track_changes","order":1,"disabled":false,"hidden":false}]
machine 2 events
[{"id":"cd1481c4.40c82","type":"ui_template","z":"f4651491.221e58","group":"36f756ac.c76382","name":"Picture Events","order":8,"width":"0","height":"0","format":"<style>\n body {\n background-image: url(\"/Pictures/metal_3.jpg\");\n background-repeat: repeat;\n }\n #Events_Uplink {\n background-image: url(\"/Pictures/metal_2.jpg\");\n }\n #Events_WAP {\n background-image: url(\"/Pictures/metal_2.jpg\");\n }\n #Events_SOM {\n background-image: url(\"/Pictures/metal_2.jpg\");\n }\n #Events_IFF {\n background-image: url(\"/Pictures/metal_2.jpg\");\n }\n #Events_MQTT {\n background-image: url(\"/Pictures/metal_2.jpg\");\n }\n #Events_Health {\n background-image: url(\"/Pictures/metal_2.jpg\");\n }\n #Events_Tasmota {\n background-image: url(\"/Pictures/metal_2.jpg\");\n }\n #Events_Power_Requests {\n background-image: url(\"/Pictures/metal_2.jpg\");\n }\n #Events_EXIT {\n background-image: url(\"/Pictures/metal_2.jpg\");\n }\n </style>\n","storeOutMessages":true,"fwdInMessages":true,"resendOnRefresh":false,"templateScope":"local","x":100,"y":40,"wires":[[]]},{"id":"36f756ac.c76382","type":"ui_group","name":"SOM","tab":"1a0ae545.bbf803","order":7,"disp":true,"width":"6","collapse":true},{"id":"1a0ae545.bbf803","type":"ui_tab","name":"Events","icon":"list","order":3,"disabled":false,"hidden":false}]
Now, I also just remembered this quirk which has been explained but it still isn't clear what is going on.
As there are problems with which pages it works on.
I just need time to get my head around those ones.
Something to do with spaces in group names and tab names.
![]()


