Dashboard 2.0 Chart not showing timestamped data from mysql

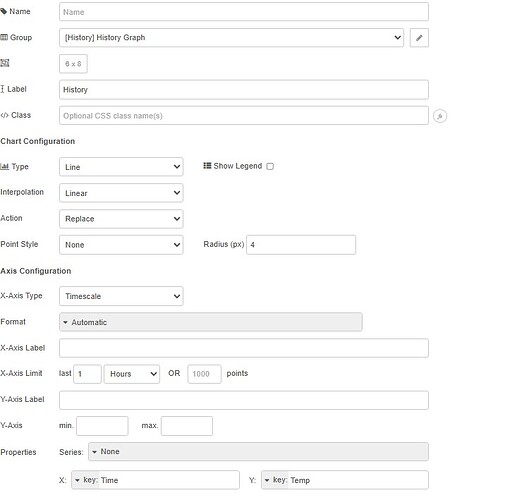
I have temperature data with timestamps output as an array from Mysql, sent to the chart widget on node red Dashboard 2.0, with the settings to be line chart, x-axis timescale, and x and y to use relevant keys. No matter how many changes I make, the chart shows nothing, it only shows the data if I change x-axis to linear, but that doesn't show time or any y axis data.

The timestamps are in milliseconds (confirmed since I can click on them in debug to show the actual time).


I've tried changing both x and y to strings, tried changing from timestamps to dateLocale, and changing keys, and deleting chart data. Normal real time (current timestamp) charts work fine, but I need a way to display history from any day.

Theoretically this should be the way to do it, I guess I'm missing something very obvious. Dashboard 2.0 charts supposedly do not need much formatting of database data (hence no function/change node to post), so I'm wondering why this doesn't work.

It worked in the original dashboard, with data modified through a function node.

This is with node red 3.1.3, node.js 18 and the latest Dashboard 2.0. I've been told this is a very old node-red version, but I just went through the hell of updating my nodes and install to 3.1.3 a scant year and a half ago, and I'd rather not repeat that every couple years.

Welcome to the forum @ccman

Can you try extracting the timestamp as a date object?
SELECT foo AS Temp, FROM_UNIXTIME(bar / 1000) AS Time FROM wibble

I have a Dashboard 2 line chart showing temperature against time and my select statement is like that.
I can't recall if it was for convenience of formatting the x axis labels or if it was essential to get the line chart to work.

Hey @ccman, welcome to the forum! I just tried sending data exactly like yours to the chart, and it worked fine for me. I’m on Dashboard 1.29.0 , Node-RED 4.1.0 , and Node.js 22.17.1 . It might be due to version differences — you could try updating them to see if that resolves the issue.

Thanks for the answer. Another person also said they tried sending identical data and it worked, so I'm guessing it's some bug with node red 3. However, updating to 4 means a lot of work. I have a couple dozen very complicated flows, using a dozen installed nodes, and as I mentioned, I just went through hell updating a little over a year ago to 3. I was hoping there was a fix for my situation.

I've tried formatting it as a long format date string, no luck. I also tried your method, and it was a date string, "2025-10-05T17:00:15.000Z", no luck. Thanks for your help.

Setup a parallel system for testing and update it to node red v4. Then you know you can safely upgrade the old one.
What sort of problems did you have when upgrading to 3? I have never had any problems with such upgrades.

I use a combination of Oracle, Mysql, Modbus, MQTT, IOT, and various other things, about a dozen installed nodes. About half of those nodes stopped working in the migration or wouldn't install at all, forcing me to find alternatives that needed different inputs and produced different outputs, forcing me to redo a hell of a lot of function/change nodes. I have to do that for about two dozen very large flows in order to fix this one problem... which is something I'd rather avoid.

I think those problems were most likely due to upgrading nodejs rather than node red.

Upgrading node red would not stop nodes from installing.

Edit: node red 4 will work with nodejs 18 so no need to upgrade that this time.

1 Like

What hardware and OS are you running on, and how did you install node-red?

To check that it is not your flow, import this and click the button.

[{"id":"26a050265c4c7834","type":"ui-button","z":"997da33a0beedade","group":"4f87bd59a15b847e","name":"Chart historical data test","label":"Chart historical data test","order":1,"width":"2","height":"1","emulateClick":false,"tooltip":"","color":"","bgcolor":"","className":"","icon":"","iconPosition":"left","payload":"","payloadType":"str","topic":"topic","topicType":"msg","buttonColor":"","textColor":"","iconColor":"","enableClick":true,"enablePointerdown":false,"pointerdownPayload":"","pointerdownPayloadType":"str","enablePointerup":false,"pointerupPayload":"","pointerupPayloadType":"str","x":190,"y":4780,"wires":[["42cfd9a2aaf318dd","846238b9a1518746"]]},{"id":"42cfd9a2aaf318dd","type":"function","z":"997da33a0beedade","name":"Time sequence sine wave","func":"const numSamples = 13\nconst start = new Date(\"2025-10-16T00:00:00Z\").getTime()\nconst interval = 5000\n\n// array for flowfuse dashboard\nmsg.payload = []\nfor (let i=0; i<numSamples; i++) {\n    const time = start + i*interval\n    const value = Math.sin(time/10000)// Math.random() * (max-min) + min\n    msg.payload.push({x: time, y: value})\n}\nmsg.topic = \"time test\"\nreturn msg","outputs":1,"timeout":0,"noerr":0,"initialize":"","finalize":"","libs":[],"x":470,"y":4780,"wires":[["d532784a4045c2da","0d8e356f28df6a11"]]},{"id":"d532784a4045c2da","type":"ui-chart","z":"997da33a0beedade","group":"4f87bd59a15b847e","name":"x axis timestamp test","label":"x axis timestamp test","order":2,"chartType":"line","category":"topic","categoryType":"msg","xAxisLabel":"","xAxisProperty":"x","xAxisPropertyType":"property","xAxisType":"time","xAxisFormat":"","xAxisFormatType":"{HH}:{mm}:{ss}","xmin":"","xmax":"","yAxisLabel":"","yAxisProperty":"y","yAxisPropertyType":"property","ymin":"","ymax":"","bins":10,"action":"replace","stackSeries":false,"pointShape":"circle","pointRadius":"3","showLegend":false,"removeOlder":"1","removeOlderUnit":"86400","removeOlderPoints":"","colors":["#0095ff","#ff0000","#ff7f0e","#2ca02c","#a347e1","#d62728","#ff9896","#9467bd","#c5b0d5"],"textColor":["#346cda"],"textColorDefault":false,"gridColor":["#2dd920"],"gridColorDefault":false,"width":"4","height":"4","className":"","interpolation":"linear","x":780,"y":4780,"wires":[[]]},{"id":"0d8e356f28df6a11","type":"debug","z":"997da33a0beedade","name":"debug 23","active":true,"tosidebar":true,"console":false,"tostatus":false,"complete":"false","statusVal":"","statusType":"auto","x":650,"y":4880,"wires":[]},{"id":"4f87bd59a15b847e","type":"ui-group","name":"test","page":"c6ff182a4185f2f2","width":"6","height":"1","order":1,"showTitle":true,"className":"","visible":"true","disabled":"false","groupType":"default"},{"id":"c6ff182a4185f2f2","type":"ui-page","name":"Test page","ui":"ID-BASE-1","path":"/testpage","icon":"home","layout":"grid","theme":"f9b6670b127dc219","breakpoints":[{"name":"Default","px":"0","cols":"3"},{"name":"Tablet","px":"576","cols":"6"},{"name":"Small Desktop","px":"768","cols":"9"},{"name":"Desktop","px":"1024","cols":"12"}],"order":5,"className":"","visible":"true","disabled":"false"},{"id":"ID-BASE-1","type":"ui-base","name":"Dashboard","path":"/dashboard","appIcon":"","includeClientData":false,"acceptsClientConfig":["ui-control","ui-notification","ui-gauge-classic"],"showPathInSidebar":false,"headerContent":"page","titleBarStyle":"default","showReconnectNotification":false,"notificationDisplayTime":"1","showDisconnectNotification":true,"allowInstall":true},{"id":"f9b6670b127dc219","type":"ui-theme","name":"FlowForge Theme","colors":{"surface":"#152a47","primary":"#005aff","bgPage":"#ffffff","groupBg":"#ffffff","groupOutline":"#cc3e3e"},"sizes":{"pagePadding":"12px","groupGap":"12px","groupBorderRadius":"4px","widgetGap":"12px","density":"default"}},{"id":"3d78e39bfaee6c54","type":"global-config","env":[],"modules":{"@flowfuse/node-red-dashboard":"1.29.0"}}]```

Running on intel windows, installed using NPM. Your flow also gives no plots on the graph when the button is pressed, so yes, it's a bug with my specific install. However this bug only affects this very specific use case, everything else works, including plotting with x/y data, just not timescale graphs. I'll look into making a new version 4 install with node 18 on an different computer and migrating flows to see if they break. Otherwise I might just resort to using dashboard 1 to do this specific task, since I already have a working flow for that, and it's a lot less work. Thanks for the help.

Update: I've done the above, a new v4/node18 install on another computer. Your flow worked on that one, so it's confirmed. I'll have to gradually migrate and test the flows. They're used daily so I have to keep the disruptions to a minimum.

Another update: So my flow is working, but for some reason the line chart doesn't show up until I've switched tabs on my browser to another tab and coming back to the dashboard (or clicked somewhere on the page) . Otherwise, the chart remains unpopulated no matter how long I wait. This happens on Chrome, Firefox, and Edge. If I refresh, it clears any old data, and remains unpopulated. Your example flow populates in real time for some reason. I'm guessing no input = no show, so I did a workaround by placing a "display" button that does nothing, but it will make the chart update.

Which version of node red?

It's working on the other computer running the latest node red with node.js 18. I still can't figure out why it's not refreshing the chart immediately, I also tried just pushing the data into the flow you provided with the same result. At least the workaround of pressing a button (that does nothing) works.

If you add an Inject node feeding the Time Sequence function node to the flow I posted, and view that in one browser window, and view the chart in another, at the same time, then does clicking the inject update the chart?

I see that too. If a chart populated with historical data is refreshed the data is lost, that is a bug. I will submit an issue for that and put a link to it here.

Hey, thanks for sticking on this. Basically any click on the screen or clicking away from the screen (such as clicking/alt-tabbing to another window) will make the chart show the injected data. This also applies for even when I don't send it new data... it seems to refresh the chart with the data previously sent. With your flow, it just shows up, but with my data, it doesn't matter if I'm sending it 5 data points or 5000, it needs some action to show.

I tried sticking your chart on the same page and injecting the same mysql data (and your example data) simultaneously into both your chart and mine, adjusting the x and y keys to match. The same thing happens, requiring a click to show, even though if I inject your data directly, it shows immediately, on your chart and mine. I've tried stripping all extra info from the data by using a change node with msg.payload=msg.payload, but there was no change.

How did you configure the change node?

Use a Function node to clear other properties, containing just

return {payload: msg.payload}

My chart is expecting a topic, so you will have to set Series to None in my chart if you are not sending a series name in msg.topic.

Strangely I can no longer repeat the problem that refreshing the page clears the chart.

I was looking to strip the msg of everything not in the payload in case that was the issue, so I used a change node with msg.payload = msg.payload (which does the above), and it did that. I already changed your chart to not expect a topic, and changed the keys accordingly to match. As I said, it's still the same behavior, on the same page: with your inputs, both charts show immediately, while my mysql inputs need me to do something before it shows.
Here's my msg.payload data copied from my flow:

[{"Time":1759856450000,"Temp":19.4,"Humid":60.04},{"Time":1759856510000,"Temp":19.43,"Humid":60.12},{"Time":1759856570000,"Temp":19.56,"Humid":59.98},{"Time":1759856630000,"Temp":19.59,"Humid":59.51},{"Time":1759856690000,"Temp":19.46,"Humid":59.29},{"Time":1759856750000,"Temp":19.35,"Humid":60},{"Time":1759856810000,"Temp":19.39,"Humid":60.1},{"Time":1759856870000,"Temp":19.49,"Humid":59.98},{"Time":1759856930000,"Temp":19.59,"Humid":59.8},{"Time":1759856990000,"Temp":19.56,"Humid":59.21},{"Time":1759857050000,"Temp":19.32,"Humid":59.69},{"Time":1759857110000,"Temp":19.35,"Humid":60.06},{"Time":1759857170000,"Temp":19.44,"Humid":60.04},{"Time":1759857230000,"Temp":19.53,"Humid":59.87},{"Time":1759857290000,"Temp":19.57,"Humid":59.3},{"Time":1759857350000,"Temp":19.37,"Humid":59.42},{"Time":1759857410000,"Temp":19.33,"Humid":60.07},{"Time":1759857470000,"Temp":19.4,"Humid":60.02},{"Time":1759857530000,"Temp":19.53,"Humid":59.89},{"Time":1759857590000,"Temp":19.6,"Humid":59.49},{"Time":1759857650000,"Temp":19.43,"Humid":59.23},{"Time":1759857710000,"Temp":19.33,"Humid":59.92},{"Time":1759857770000,"Temp":19.37,"Humid":59.98},{"Time":1759857830000,"Temp":19.46,"Humid":59.91},{"Time":1759857890000,"Temp":19.59,"Humid":59.71},{"Time":1759857950000,"Temp":19.47,"Humid":59.13},{"Time":1759858010000,"Temp":19.33,"Humid":59.58},{"Time":1759858070000,"Temp":19.37,"Humid":59.94},{"Time":1759858130000,"Temp":19.46,"Humid":59.9},{"Time":1759858190000,"Temp":19.57,"Humid":59.77},{"Time":1759858250000,"Temp":19.56,"Humid":59.16},{"Time":1759858310000,"Temp":19.35,"Humid":59.26},{"Time":1759858370000,"Temp":19.33,"Humid":59.92},{"Time":1759858430000,"Temp":19.4,"Humid":59.99},{"Time":1759858490000,"Temp":19.49,"Humid":59.85},{"Time":1759858550000,"Temp":19.59,"Humid":59.58},{"Time":1759858610000,"Temp":19.39,"Humid":59.31},{"Time":1759858670000,"Temp":19.31,"Humid":59.81},{"Time":1759858730000,"Temp":19.39,"Humid":59.9},{"Time":1759858790000,"Temp":19.46,"Humid":59.85},{"Time":1759858850000,"Temp":19.57,"Humid":59.71},{"Time":1759858910000,"Temp":19.52,"Humid":59.17},{"Time":1759858970000,"Temp":19.28,"Humid":59.55},{"Time":1759859030000,"Temp":19.33,"Humid":59.99},{"Time":1759859090000,"Temp":19.42,"Humid":59.89},{"Time":1759859151000,"Temp":19.52,"Humid":59.81},{"Time":1759859211000,"Temp":19.54,"Humid":59.39},{"Time":1759859271000,"Temp":19.39,"Humid":59.31},{"Time":1759859331000,"Temp":19.33,"Humid":59.94},{"Time":1759859391000,"Temp":19.35,"Humid":59.94},{"Time":1759859451000,"Temp":19.47,"Humid":59.81},{"Time":1759859511000,"Temp":19.6,"Humid":59.63},{"Time":1759859571000,"Temp":19.49,"Humid":59.06},{"Time":1759859631000,"Temp":19.33,"Humid":59.51},{"Time":1759859691000,"Temp":19.37,"Humid":59.89},{"Time":1759859751000,"Temp":19.47,"Humid":59.86},{"Time":1759859811000,"Temp":19.56,"Humid":59.69},{"Time":1759859871000,"Temp":19.54,"Humid":59.11},{"Time":1759859931000,"Temp":19.37,"Humid":59.28},{"Time":1759859991000,"Temp":19.36,"Humid":59.82}]

This is a fresh install of node.js and node red. I am wondering if I update to node 20 or 22, would the issue disappear? I do have nvm installed.
Please show me how you have configured the change node.