Edit the Page node and point it to your original ui-base, then in Configuration Nodes you will be able to delete the now unused one.
If you edit a page using that ui-base then you can open the ui-base and call it what you like. I guess that the imported flow had that as its ui-base name. Or you can find it in Configuration nodes and rename it there.
Thanks Colin.
This is an example flow and since D2 is not yet released, the example must by definition be aimed at beginners.
I suppose I wanted to stimulate discussion about how helpful the help should be to those not already familiar with the jargon.
If an example presents "weather data" then surely it should be called "Weather Example" rather than "Discourse Forums"?
Edit - Maybe "Weather Example" is at a lower level than ui-base, so "Dashboard2 Example" would be better.
A significant part of my confusion arises from not yet knowing what a ui-base is. I'm starting to think it would be better named ui-url or even ui-browsertab
OK, I see now that you mean it is the example that should have it as a different name.
Certainly there is a lot of work to do on the docs still.
As usual. Pull requests that help improve docs are just as valid as code contributions. (And help take the load off Joe so he can implement all the missing pieces we all want ![]() )
)
Thanks @joepavitt, that's promising! It's delightful not to have to loop through the API output setting x,y coordinates for each point.
This flow

gives me this result
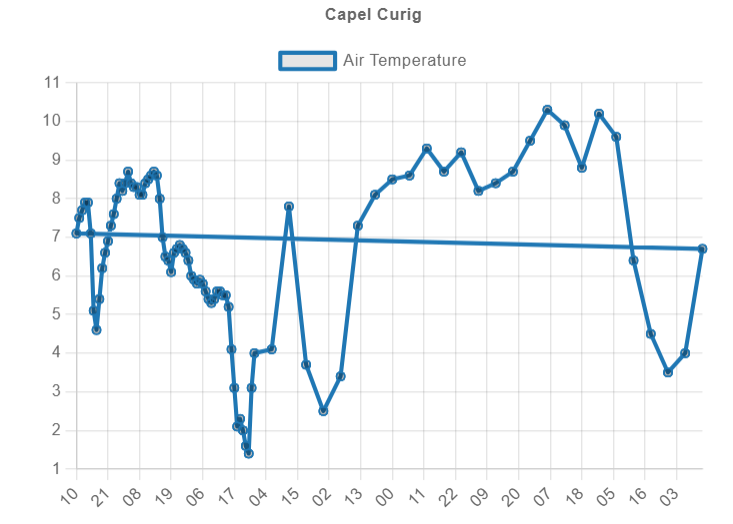
Why does the line return from the last datum to the first?
The chart node has a "Label" (front-end label) property but no "Name" property, unlike D1 widgets. Is this a deliberate decision?
Next step - two lines on the same chart... Temperature at two locations or Temperature, Humidity at one location. Decisions decisions...
Did that happpen when you re-drew the chart? If so then there is an issue for that Chart: Append/Replace Data Option · Issue #358 · FlowFuse/node-red-dashboard · GitHub
For the moment, send the chart an empty array to clear it before re-drawing.
Yes, it happens on a second inject. Thanks.
The difficulty in putting humidity in the same chart is that humidity could be 95%, whilst temperature (in the UK!) Is likely to be no more than 10C, so the chart would scale to the largest number, and the temperature would just be a straight line just above the x-axis.
Hopefully at some later stage in development, we'll be able to use left & right y axis, and scale them each accordingly.
Thanks for the feedback, as an avid user of Dashboard 1.0 charts, it as one of the features I was most desperate to get working when I started on this project.
As @Colin kindly answered for me - you're experience the append/replace problem.