DB2: chart.js chart cleared on changing tabs

Hello:

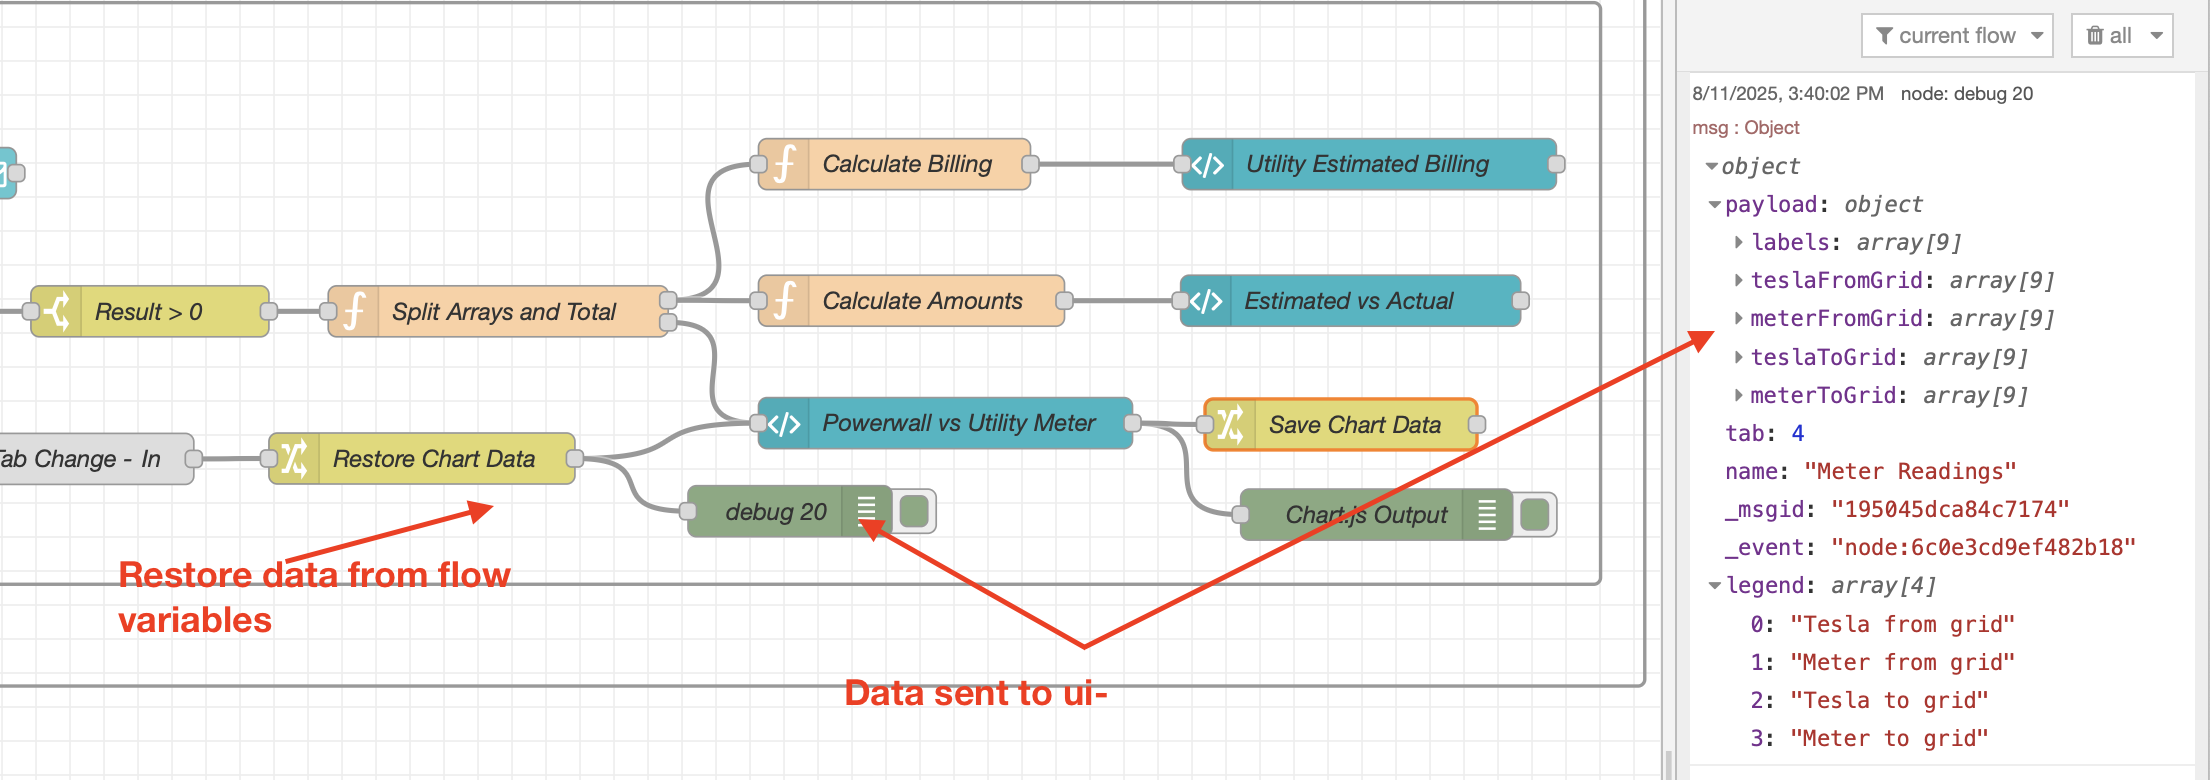
I have migrated my DB1 dashboard to DB2. Everything is working (mostly) except for my charts that use charts.js - they are cleared when I change tabs. Based on previous discussions here, my understanding is that I can save the data and then repopulate the chart when the tab is selected. I save the original data in flow variables and then send them back in when the tab is re-selected. However, this does not appear to work even though I can see the data being sent to the ui-template node (and coming out from it).

I am not vue/CSS/javascript literate and have been bumbling my way through this but have it almost working. Would someone be able to look at the ui-template code and see if I am missing something? Or is there an alternate way to do an automatic refresh?

Thanks for your help.

ui-template code
//WIP - 8/4/2025 3:45 PM

/*
2025-08-04: Colors in arrays did not work, colors assigned to each dataset
2025-08-04: Order of dataset determines stacking (from_grid Tesla/Meter, followed by to_grid Tesla/Meter).
2025-08-04: Added grid display -> working
2025-08-04: Added white color for labels (tick.color)
2025-08-04: Added rotation for x-axis vertical lables - works with minRotation property
2025-08-04: Added weight and size to ticks (x and y values)
2025-08-04: Added x-axislabel (kWh) with size and weight 
*/


<template>
    <div class="base-container">
        <div class="chart-container"><canvas ref="meterchart1" /></div>
    </div>
</template>

<script src="https://cdn.jsdelivr.net/npm/chart.js"></script>


<script>
    /* Assign chart colors and defaults 
    let textcolor = "white";
    let gridcolor = "rgba(200, 200, 200, 0.5)";
    let linecolors = ["#5FB404", "#E68C05", "#0489B1", "#D7DF01"];
    let barPercent = 0.8
     End assign chart colors and defaults */

    
    export default {        
        data() {
            return {
                isChartLoaded: false,
                dataSets: [],
            }
        },

        watch: {
            msg: function () {
                if (this.isChartLoaded && this.msg.payload && this.msg.payload.labels) {
                    this.onInput(this.msg.payload);
                }
            }
        },

        mounted() {
            let interval = setInterval(() => {
                if (window.Chart) {
                    clearInterval(interval);
                    this.draw();
                    this.isChartLoaded = true;
                }
            }, 100);
        },

        methods: {
            draw() {
                const ctx = this.$refs.meterchart1;
                const chart = new Chart(ctx, {
                    type: 'bar',
                    data: {
                        labels: [],
                        datasets: [
                            {
                                label: 'Tesla - From Grid',
                                data: [],
                                backgroundColor: "#5FB404",
                                borderColor: "#5FB404",
                                stack: 'tesla'
                            },
                            {
                                label: 'Meter - From Grid',
                                data: [],
                                backgroundColor: "#0489B1",
                                borderColor: "#0489B1",
                                stack: 'meter'
                            },
                            {
                                label: 'Tesla - To Grid',
                                data: [],
                                backgroundColor: "#E68C05",
                                borderColor: "#E68C05",
                                stack: 'tesla'
                            },
                            {
                                label: 'Meter - To Grid',
                                data: [],
                                backgroundColor: "#D7DF01",
                                borderColor: "#D7DF01",
                                stack: 'meter'
                            }
                        ]
                    },
                    options: {
                        maintainAspectRatio: false,
                        animation: false,
                        responsive: true,
                        plugins: {
                            legend: {
                                position: 'bottom',
                                labels:{
                                    color:'white'
                                }
                            },
                            title: {
                                display: false,
                                text: 'Tesla vs Meter - Injected data'
                            }
                        },
                        scales: {
                            x: {
                                stacked:true,
                                grid: {
                                    display: true,
                                    drawOnChartArea: true,
                                    drawTicks: true,
                                    color: 'rgba(200, 200, 200, 0.25)'
                                },
                                ticks:{
                                    color:'white',
                                    minRotation: 90,
                                    font:{
                                        size:13,
                                        weight: 'bold'
                                    }
                                },
                            },
                            y: {
                                type: 'linear',
                                display: true,
                                position: 'left',
                                grid: {
                                    display: true,
                                    drawOnChartArea: true,
                                    drawTicks: true,
                                    color: 'rgba(200, 200, 200, 0.25)'
                                },
                                ticks:{
                                    color:'white',
                                    font:{
                                        size:13,
                                        weight: 'bold'
                                    }
                                },
                                title:{
                                    display:true,
                                    text:'kWh',
                                    color:'white',
                                    font:{
                                        weight: 'bold',
                                        size:13
                                    },
                                },
                            },
                        }
                    },
                });

                this.chart = chart;
            },

            onInput(inputData) {
                if (!inputData || !Array.isArray(inputData.labels)) return;

                this.dataSets = this.chart.data.datasets;

                // Clear previous data
                this.dataSets.forEach(dataset => dataset.data = []);
                this.chart.data.labels = [];

                // Assign new data directly from arrays
                this.chart.data.labels = inputData.labels;
                this.dataSets[0].data = inputData.teslaFromGrid;
                this.dataSets[1].data = inputData.meterFromGrid;
                this.dataSets[2].data = inputData.teslaToGrid;
                this.dataSets[3].data = inputData.meterToGrid;

                this.updateChart();
            },

            updateChart() {
                if (this.chart) {
                    this.dataSets.forEach((element, index) => {
                        this.chart.data.datasets[index].data = element.data;
                    });
                    this.chart.update();
                }
            },

            clearChart() {
                if (this.dataSets.length > 0) {
                    this.dataSets.forEach(element => element.data = []);
                    this.updateChart();
                }
            }
        }
    }
</script>

<style>
    .base-container {
        width: 100%;
        height: 100%;
        display: flex;
        justify-content: center;
        align-items: center;
        container: chat / size;
    }

    .chart-container {
        position: relative;
        margin: auto;
        height: 100%;
        width: 100%;
        display: flex;
        justify-content: center;
        align-items: center;
    }
</style>

Screenshot showing data being resent to ui-template

Screenshot - Node-RED flow editor

UPDATE: I have tried to simulate a button-click by sending a payload to ui-button when the tab is changed back to the original one. While a physical click works to refresh the chart, the incoming payload does not trigger a refresh. My ui-button configuration is below.

Any help would be really appreciated. :folded_hands:t3:

UPDATE2: After spending most of the day today debugging what was going on, I am still no closer to the solution but have a theory of what might be going on.

It looks like the only way the code executes the onInput() section of the ui-template code is if I physically click the ā€œUpdateā€ button. In looking at the console log debug statements, I can see that the data has been received but is not shown on the chart.

That happens only when the ā€œUpdateā€ button is clicked.

After the chart has been rendered, if I change tabs and come back, the chart is blank again but the data is still here.

Could someone please take a look at the code? Maybe I’m just missing something obvious in the configuration or maybe this is just the way ui-template behaves and I have to think of an alternate approach, but any guidance/tips would be really appreciated.

Thanks for your help.

Chart.js flow with sample data

[{"id":"efa7c0f82fb7315e","type":"ui-template","z":"b1e26331f5b8312f","group":"6e1882b581f643ad","page":"","ui":"","name":"Test Chart","order":2,"width":"24","height":"8","head":"","format":"//WIP - 8/12/2025 8:22 AM\n\n/*\n2025-08-04: Colors in arrays did not work, colors assigned to each dataset\n2025-08-04: Order of dataset determines stacking (from_grid Tesla/Meter, followed by to_grid Tesla/Meter).\n2025-08-04: Added grid display -> working\n2025-08-04: Added white color for labels (tick.color)\n2025-08-04: Added rotation for x-axis vertical lables - works with minRotation property\n2025-08-04: Added weight and size to ticks (x and y values)\n2025-08-04: Added x-axislabel (kWh) with size and weight \n*/\n\n\n<template>\n    <div class=\"base-container\">\n        <div class=\"chart-container\"><canvas ref=\"metercharttest\" /></div>\n    </div>\n</template>\n\n<script src=\"https://cdn.jsdelivr.net/npm/chart.js\"></script>\n\n\n\n<script>\n    /* Assign chart colors and defaults \n    let textcolor = \"white\";\n    let gridcolor = \"rgba(200, 200, 200, 0.5)\";\n    let linecolors = [\"#5FB404\", \"#E68C05\", \"#0489B1\", \"#D7DF01\"];\n    let barPercent = 0.8\n     End assign chart colors and defaults */\n\n    \n    export default {        \n        data() {\n            return {\n                isChartLoaded: false,\n                dataSets: [],\n            }\n        },\n\n        watch: {\n            msg: function () {\n                \n                /*Commenting this out - on first go, these are not defined)\n                console.log('Chart loaded?:',this.isChartLoaded);\n                console.log('Payload:',this.msg.payload)\n                */\n               \n                if (this.isChartLoaded && this.msg.payload && this.msg.payload.labels) {\n                    this.onInput(this.msg.payload);\n\n                    //---Logging---\n                    console.log('data received',this.msg.payload);\n                    console.log('Labels:',this.msg.payload.labels)\n\n                }\n            }\n        },\n\n        mounted() {\n            let interval = setInterval(() => {\n                if (window.Chart) {\n                    clearInterval(interval);\n                    this.draw();\n                    this.isChartLoaded = true;\n                    this.updateChart();\n\n                    //---Logging---\n                    console.log('Chart loaded');\n                    console.log('updateChart() - called from mounted()');\n                    //---Logging---\n                    console.log('data exists? - mounted():',this.msg.payload);\n                    console.log('Labels? - mounted():',this.msg.payload.labels)\n                }\n            }, 100);\n        },\n        unmounted() {\n        // Code to run after the component is unmounted\n            console.log('Component has been unmounted!');\n            //this.dataSets.forEach(dataset => dataset.data = []);\n            //this.chart.data.labels = [];\n            //this.msg = null;\n        } ,\n\n        methods: {\n            draw() {\n                const ctx = this.$refs.metercharttest;\n                console.log('Canvas Ref:',ctx)\n                const chart = new Chart(ctx, {\n                    type: 'bar',\n                    data: {\n                        labels: [],\n                        datasets: [\n                            {\n                                label: 'Tesla - From Grid',\n                                data: [],\n                                backgroundColor: \"#5FB404\",\n                                borderColor: \"#5FB404\",\n                                stack: 'tesla'\n                            },\n                            {\n                                label: 'Meter - From Grid',\n                                data: [],\n                                backgroundColor: \"#0489B1\",\n                                borderColor: \"#0489B1\",\n                                stack: 'meter'\n                            },\n                            {\n                                label: 'Tesla - To Grid',\n                                data: [],\n                                backgroundColor: \"#E68C05\",\n                                borderColor: \"#E68C05\",\n                                stack: 'tesla'\n                            },\n                            {\n                                label: 'Meter - To Grid',\n                                data: [],\n                                backgroundColor: \"#D7DF01\",\n                                borderColor: \"#D7DF01\",\n                                stack: 'meter'\n                            }\n                        ]\n                    },\n                    options: {\n                        maintainAspectRatio: false,\n                        animation: false,\n                        responsive: true,\n                        plugins: {\n                            legend: {\n                                position: 'bottom',\n                                labels:{\n                                    color:'white'\n                                }\n                            },\n                            title: {\n                                display: false,\n                                text: 'Tesla vs Meter - Injected data'\n                            }\n                        },\n                        scales: {\n                            x: {\n                                stacked:true,\n                                grid: {\n                                    display: true,\n                                    drawOnChartArea: true,\n                                    drawTicks: true,\n                                    color: 'rgba(200, 200, 200, 0.25)'\n                                },\n                                ticks:{\n                                    color:'white',\n                                    minRotation: 90,\n                                    font:{\n                                        size:13,\n                                        weight: 'bold'\n                                    }\n                                },\n                            },\n                            y: {\n                                type: 'linear',\n                                display: true,\n                                position: 'left',\n                                grid: {\n                                    display: true,\n                                    drawOnChartArea: true,\n                                    drawTicks: true,\n                                    color: 'rgba(200, 200, 200, 0.25)'\n                                },\n                                ticks:{\n                                    color:'white',\n                                    font:{\n                                        size:13,\n                                        weight: 'bold'\n                                    }\n                                },\n                                title:{\n                                    display:true,\n                                    text:'kWh',\n                                    color:'white',\n                                    font:{\n                                        weight: 'bold',\n                                        size:13\n                                    },\n                                },\n                            },\n                        }\n                    },\n                });\n\n                this.chart = chart;\n                console.log('Chart Ref:',this.chart)\n            },\n\n            onInput(inputData) {\n                \n                if (!inputData || !Array.isArray(inputData.labels)) return;\n\n                this.dataSets = this.chart.data.datasets;\n\n                // Clear previous data\n                this.dataSets.forEach(dataset => dataset.data = []);\n                this.chart.data.labels = [];\n\n                // Assign new data directly from arrays\n                this.chart.data.labels = inputData.labels;\n                this.dataSets[0].data = inputData.teslaFromGrid;\n                this.dataSets[1].data = inputData.meterFromGrid;\n                this.dataSets[2].data = inputData.teslaToGrid;\n                this.dataSets[3].data = inputData.meterToGrid;\n\n                \n\n                this.updateChart();\n\n                //--logging---\n                console.log('Data mapped onInput()');\n                console.log('updateChart() called from onInput()');\n            },\n\n            updateChart() {\n                if (this.chart) {\n                    this.dataSets.forEach((element, index) => {\n                        this.chart.data.datasets[index].data = element.data;\n                    });\n                    this.chart.update();\n\n                    //logging\n                    /*\n                    console.log('Chart labels',this.chart.data.labels);\n                    console.log('Tesla From',this.dataSets[0].data);\n                    console.log('Meter From',this.dataSets[1].data);\n                    console.log('Tesla To',this.dataSets[2].data);\n                    console.log('Meter To',this.dataSets[3].data);\n                    */\n                    console.log('this.chart.update() - called from updateChart()');\n\n                }\n            },\n\n            clearChart() {\n                if (this.dataSets.length > 0) {\n                    this.dataSets.forEach(element => element.data = []);\n                    this.updateChart();\n                    \n                    //logging\n                     console.log('Chart cleared??');\n                     console.log('updateChart() called from clearChart()');\n                }\n            }\n        }\n    }\n</script>\n\n<style>\n    .base-container {\n        width: 100%;\n        height: 100%;\n        display: flex;\n        justify-content: center;\n        align-items: center;\n        container: chat / size;\n    }\n\n    .chart-container {\n        position: relative;\n        margin: auto;\n        height: 100%;\n        width: 100%;\n        display: flex;\n        justify-content: center;\n        align-items: center;\n    }\n</style>","storeOutMessages":true,"passthru":true,"resendOnRefresh":true,"templateScope":"local","className":"","x":719.6471862792969,"y":501.89892578125,"wires":[["ef0d30dc74e0b4b8"]]},{"id":"73fc5bf37cd78d08","type":"change","z":"b1e26331f5b8312f","name":"Send Data","rules":[{"t":"set","p":"payload","pt":"msg","to":"{\t   \"labels\":[\t       \"2025-08-01\",\t       \"2025-08-02\",\t       \"2025-08-03\",\t       \"2025-08-04\",\t       \"2025-08-05\",\t       \"2025-08-06\",\t       \"2025-08-07\",\t       \"2025-08-08\",\t       \"2025-08-09\",\t       \"2025-08-10\"\t   ],\t   \"teslaFromGrid\":[\t       45.47,\t       40.42,\t       36.28,\t       28.638,\t       21.658,\t       40.992,\t       46.346,\t       51.63,\t       44.96,\t       38.994\t   ],\t   \"meterFromGrid\":[\t       45.84,\t       40.709,\t       36.523,\t       28.83,\t       21.802,\t       41.311,\t       46.731,\t       52.072,\t       45.323,\t       39.286\t   ],\t   \"teslaToGrid\":[\t       -0.065,\t       -0.08,\t       -0.119,\t       -0.103,\t       -0.78,\t       -0.092,\t       -0.089,\t       -0.08,\t       -0.099,\t       -0.115\t   ],\t   \"meterToGrid\":[\t       -0.07,\t       -0.099,\t       -0.153,\t       -0.135,\t       -0.808,\t       -0.127,\t       -0.105,\t       -0.084,\t       -0.081,\t       -0.138\t   ]\t}","tot":"json"},{"t":"set","p":"legend","pt":"msg","to":"[\"Tesla from grid\",\"Meter from grid\",\"Tesla to grid\",\"Meter to grid\"]","tot":"json"}],"action":"","property":"","from":"","to":"","reg":false,"x":517.6507873535156,"y":503.80328369140625,"wires":[["efa7c0f82fb7315e","6e9fb3f5863cde15"]]},{"id":"535bc6406c56e483","type":"ui-control","z":"b1e26331f5b8312f","name":"Refresh Tab","ui":"de5759a313e7ad79","events":"change","x":90.83456420898438,"y":503.82720947265625,"wires":[["de978efc70fdb48a"]]},{"id":"de978efc70fdb48a","type":"switch","z":"b1e26331f5b8312f","name":"Test Chart.js Tab","property":"name","propertyType":"msg","rules":[{"t":"eq","v":"Debug Chart.js","vt":"str"}],"checkall":"true","repair":false,"outputs":1,"x":282.35528564453125,"y":502.6519775390625,"wires":[["73fc5bf37cd78d08","b26a0cce32542d62"]]},{"id":"b26a0cce32542d62","type":"debug","z":"b1e26331f5b8312f","name":"Is Chart.js page?","active":true,"tosidebar":true,"console":false,"tostatus":false,"complete":"true","targetType":"full","statusVal":"","statusType":"auto","x":328.6543884277344,"y":566.8032836914062,"wires":[]},{"id":"6e9fb3f5863cde15","type":"debug","z":"b1e26331f5b8312f","name":"Chart Input","active":true,"tosidebar":true,"console":false,"tostatus":false,"complete":"true","targetType":"full","statusVal":"","statusType":"auto","x":586.8345947265625,"y":436.82720947265625,"wires":[]},{"id":"ef0d30dc74e0b4b8","type":"debug","z":"b1e26331f5b8312f","name":"Chart Output","active":true,"tosidebar":true,"console":false,"tostatus":false,"complete":"true","targetType":"full","statusVal":"","statusType":"auto","x":910.8347473144531,"y":501.82720947265625,"wires":[]},{"id":"dffb0562c77193af","type":"inject","z":"b1e26331f5b8312f","name":"","props":[],"repeat":"","crontab":"","once":false,"onceDelay":0.1,"topic":"","x":528.6470794677734,"y":565.4577026367188,"wires":[["73fc5bf37cd78d08"]]},{"id":"8cb8c56f867153a2","type":"ui-button","z":"b1e26331f5b8312f","group":"6e1882b581f643ad","name":"Update","label":"Update","order":1,"width":"4","height":"1","emulateClick":true,"tooltip":"","color":"","bgcolor":"","className":"","icon":"","iconPosition":"left","payload":"1","payloadType":"num","topic":"topic","topicType":"msg","buttonColor":"","textColor":"","iconColor":"","enableClick":true,"enablePointerdown":false,"pointerdownPayload":"","pointerdownPayloadType":"str","enablePointerup":false,"pointerupPayload":"","pointerupPayloadType":"str","x":328.6543884277344,"y":437.83270263671875,"wires":[["73fc5bf37cd78d08"]]},{"id":"6e1882b581f643ad","type":"ui-group","name":"Testing Chart.js","page":"3e0fcc77180ac6fa","width":"26","height":"10","order":1,"showTitle":true,"className":"","visible":"true","disabled":"false","groupType":"default"},{"id":"de5759a313e7ad79","type":"ui-base","name":"Node-RED Dashboard DB2","path":"/dashboard","appIcon":"","includeClientData":false,"acceptsClientConfig":["ui-notification","ui-control"],"showPathInSidebar":false,"headerContent":"dashboard","navigationStyle":"fixed","titleBarStyle":"default","showReconnectNotification":true,"notificationDisplayTime":5,"showDisconnectNotification":true,"allowInstall":true},{"id":"3e0fcc77180ac6fa","type":"ui-page","name":"Debug Chart.js","ui":"de5759a313e7ad79","path":"/page22","icon":"home","layout":"flex","theme":"682b37bffc90cac5","breakpoints":[{"name":"Default","px":"0","cols":"3"},{"name":"Tablet","px":"576","cols":"6"},{"name":"Small Desktop","px":"768","cols":"9"},{"name":"Desktop","px":"1024","cols":"12"}],"order":10,"className":"","visible":true,"disabled":false},{"id":"682b37bffc90cac5","type":"ui-theme","name":"Rakesh Dark","colors":{"surface":"#097479","primary":"#337278","bgPage":"#000000","groupBg":"#000000","groupOutline":"#337278"},"sizes":{"density":"comfortable","pagePadding":"6px","groupGap":"5px","groupBorderRadius":"1px","widgetGap":"6px"}}]

Importing this flow will (hopefully) it will create the appropriate ui-page and ui-group. Click on the update button on the dashboard page (it should be called Debug Chart.js) and the chart is updated. Navigate to a different page and come back, the chart is blank.

I have included console.log() statements in the ui-template code to help debug (shown in the screenshots above)

You are using the ui_template node.

A thing that caught me a lot of times with it is having to select the reload last value on refresh option.

That's way down the bottom of the node.

I haven't got into much DB-2 stuff myself as yet.
But just thought I'd mention it.

1 Like

Thanks @Trying_to_learn - this was in DB2 and I don’t see that option in ui-template (ui_template ← with the underscore vs dash, is DB1).

I think I may have figured a solution out (will post it below)

(Yeah, my bad.)

1 Like

I think I may have figured it out :face_exhaling:!!

I added in this.onInput(this.msg.payload); in the mounted()section before this.updateChart();and now it shows the chart without the physical click on the ā€œUpdateā€ button, both when initially navigating to the page and also when returning.

Here is the relevant section:

mounted() {
            let interval = setInterval(() => {
                if (window.Chart) {
                    clearInterval(interval);
                    this.draw();
                    this.isChartLoaded = true;
                    //Testing
                    this.onInput(this.msg.payload);
                    this.updateChart();

                    //---Logging---
                    console.log('Chart loaded');
                    console.log('updateChart() - called from mounted()');
                    //---Logging---
                    console.log('data exists? - mounted():',this.msg.payload);
                    console.log('Labels? - mounted():',this.msg.payload.labels)
                }
            }, 100);

I will update this post in case this breaks something else, but so far, it’s looking good. Hopefully, this will save someone else some time down the line.

The original problem is that for some reason when inputting the data via the event this.isChartLoaded == false.

No idea why at the moment but still looking.

1 Like

Could it be a timing thing? It is set to true in mounted() I think.

There is a native vue method that handles this specifically: await nextTick() - in reactive frameworks, you find that reactive DOM updates are not completed synchronously and you first have to wait until they are completed, after which you can render a chart.

eg:

async mounted(){
   await nextTick()
   this.updateChart() 
}

or

mounted(){
   this.$nextTick(() => {
      this.updateChart()  // as a callback
    });
}

I think you can put this.onInput(this.msg.payload); in created(){}.

1 Like

@bakman2 - so replace what I currently have in mounted()?

Replace this

mounted() {
            let interval = setInterval(() => {
                if (window.Chart) {
                    clearInterval(interval);
                    this.draw();
                    this.isChartLoaded = true;
                    //Testing
                    this.onInput(this.msg.payload);
                    this.updateChart();

                    //---Logging---
                    console.log('Chart loaded');
                    console.log('updateChart() - called from mounted()');
                    //---Logging---
                    console.log('data exists? - mounted():',this.msg.payload);
                    console.log('Labels? - mounted():',this.msg.payload.labels)
                }
            }, 100);

with

async mounted(){
   await nextTick()
   this.updateChart() 
};

and add

created(){
	this.onInput(this.msg.payload);
};

Also, should I also remove the this.onInput (this.msg.payload)from here?

watch: {
            msg: function () {
                if (this.isChartLoaded && this.msg.payload && this.msg.payload.labels) {
                    this.onInput(this.msg.payload);
                }
            }
        },

Thanks again for your help

I see a warning in the console log ā€œcreated" not supported in a ui-template Vue Component and that never gets executed (i have a console.log statement that I don’t see in the log). The chart seems to render fine though.

Then you could try this instead:

mounted(){
   this.onInput(this.msg.payload)
   this.$nextTick(() => {
      this.updateChart() 
    });
}

Then again, there is a mess of vuetify here as well. The setTimeout (not setInterval as that will keep spawning) within the nextTick callback could then work. It is messy.

@bakman2 - thanks for all your help. The following code seems to work without including this.onInput(this.msg.payload)in the async mounted () section. If possible, could you take a look to see if you spot any potential misses?

Working ui-template code
<template>
  <div class="base-container">
    <div class="chart-container"><canvas ref="metercharttest"></canvas></div>
  </div>
</template>

<script src="https://cdn.jsdelivr.net/npm/chart.js"></script>

<script>
export default {        
  data() {
    return {
      debug: true,           // <-- SET THIS TO false TO SILENCE ALL LOGS
      isChartLoaded: false,
      dataSets: [],
    }
  },

  watch: {
    msg: function () {
      if (this.isChartLoaded && this.msg.payload && this.msg.payload.labels) {
        this.onInput(this.msg.payload);
        if (this.debug) {
          console.log('data received', this.msg.payload);
          console.log('Labels:', this.msg.payload.labels);
        }
      }
    }
  },

  async mounted() {
    await this.$nextTick();

    this.draw();
    this.isChartLoaded = true;
    this.updateChart();

    if (this.debug) {
      console.log('updateChart() - called from mounted()');
      console.log('data exists? - mounted():', this.msg && this.msg.payload);
      console.log('Labels? - mounted():', this.msg && this.msg.payload ? this.msg.payload.labels : 'no payload');
    }
  },

  unmounted() {
    if (this.debug) {
      console.log('Component has been unmounted!');
    }
  },

  methods: {
    draw() {
      const ctx = this.$refs.metercharttest;
      if (this.debug) console.log('Canvas Ref:', ctx);

      const chart = new Chart(ctx, {
        type: 'bar',
        data: {
          labels: [],
          datasets: [
            { label: 'Tesla - From Grid', data: [], backgroundColor: "#5FB404", borderColor: "#5FB404", stack: 'tesla' },
            { label: 'Meter - From Grid', data: [], backgroundColor: "#0489B1", borderColor: "#0489B1", stack: 'meter' },
            { label: 'Tesla - To Grid', data: [], backgroundColor: "#E68C05", borderColor: "#E68C05", stack: 'tesla' },
            { label: 'Meter - To Grid', data: [], backgroundColor: "#D7DF01", borderColor: "#D7DF01", stack: 'meter' }
          ]
        },
        options: {
          maintainAspectRatio: false,
          animation: false,
          responsive: true,
          plugins: {
            legend: { position: 'bottom', labels: { color: 'white' }},
            title: { display: false, text: 'Tesla vs Meter - Injected data' }
          },
          scales: {
            x: {
              stacked:true,
              grid: { display: true, drawOnChartArea: true, drawTicks: true, color: 'rgba(200, 200, 200, 0.25)' },
              ticks:{ color:'white', minRotation: 90, font:{ size:13, weight: 'bold' }},
            },
            y: {
              type: 'linear',
              display: true,
              grid: { display: true, drawOnChartArea: true, drawTicks: true, color: 'rgba(200, 200, 200, 0.25)' },
              ticks:{ color:'white', font:{ size:13, weight: 'bold' }},
              title:{ display:true, text:'kWh', color:'white', font:{ weight: 'bold', size:13 }},
            },
          }
        },
      });
      this.chart = chart;
      if (this.debug) console.log('Chart Ref:', this.chart);
    },

    onInput(inputData) {
      if (!inputData || !Array.isArray(inputData.labels)) return;
      this.dataSets = this.chart.data.datasets;
      this.dataSets.forEach(dataset => dataset.data = []);
      this.chart.data.labels = inputData.labels;
      this.dataSets[0].data = inputData.teslaFromGrid;
      this.dataSets[1].data = inputData.meterFromGrid;
      this.dataSets[2].data = inputData.teslaToGrid;
      this.dataSets[3].data = inputData.meterToGrid;
      this.updateChart();
      if (this.debug) console.log('Data mapped onInput()');
    },

    updateChart() {
      if (this.chart) {
        this.dataSets.forEach((element, index) => {
          this.chart.data.datasets[index].data = element.data;
        });
        this.chart.update();
        if (this.debug) console.log('this.chart.update() - called from updateChart()');
      }
    },

    clearChart() {
      if (this.dataSets.length > 0) {
        this.dataSets.forEach(element => element.data = []);
        this.updateChart();
        if (this.debug) console.log('Chart cleared??');
      }
    }
  }
}
</script>

<style>
.base-container {
  width: 100%;
  height: 100%;
  display: flex;
  justify-content: center;
  align-items: center;
  container: chat / size;
}

.chart-container {
  position: relative;
  margin: auto;
  height: 100%;
  width: 100%;
  display: flex;
  justify-content: center;
  align-items: center;
}
</style>

@bakman2 - replacing the mounted () section in the ui-template with the following code fixes all charts. Thanks so much for your help. Hopefully, this will help others who may run into the same issue.

async mounted() {
      // Wait for DOM update to complete before drawing chart
      await this.$nextTick();

      this.draw();
      this.isChartLoaded = true;
      this.updateChart();
    },