DB2 Chart not displaying data

I'm using DB2, and my chart was working perfectly fine until we changed the dashboard to update at a selected time. The chart indicates that it's receiving the data correctly, but it's not displaying anything, and the data it’s receiving is within the expected range.

It isn’t reading the time correctly as I have just realized but we are unsure of how that changed.

Did you do an update of Dashboard at all in that time period? Are you able to share any sample data you’re passing into the chart?

Here is the function node feeding the chart

That is what is making the data for the chart just based off of a robot pulse.

We changed some date time setting in the RIO we where using but I feel like that shouldn’t effect the time timestamp ability of the chart.

Add a debug node showing what is going into the chart and show us what it contains.

What is an RIO? If the date/time/timezone of the device running node-red is wrong, but the date/time on the machine running the browser is correct, then the data may be off the chart.

image


The groovRIO is a small industrial controller that connects software to real-world devices like sensors, switches, and motors. It lets you monitor and control equipment using a computer or custom program. It's often used in automation projects for factories, machines, or remote systems. It has Node-RED built in

I don't understand how the chart is showing 24 hours on the x axis. It is set to show only 1 hour of information.

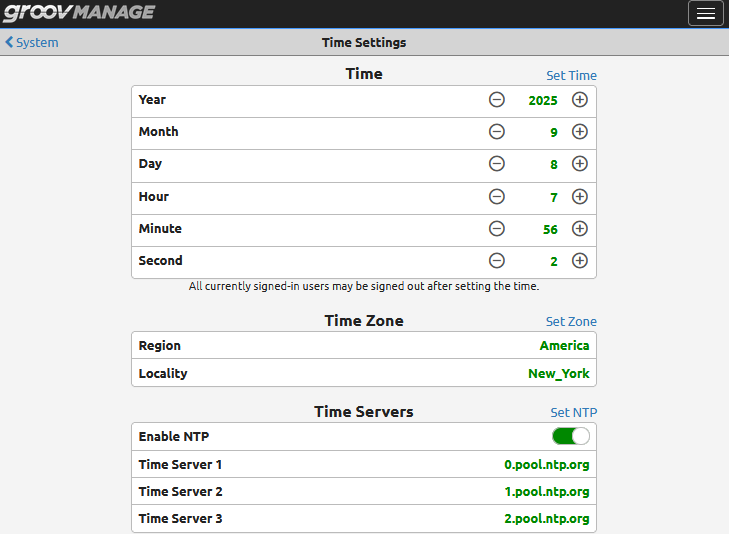
Is the RIO set to the correct date/time/timezone?
Run this flow and see what it shows. Also tell us the local time where you are and what timezone you are.

Edit, forgot the flow. Here it is

[{"id":"7c2b184388d3fc05","type":"inject","z":"4d034605ed3b642c","name":"","props":[{"p":"payload"},{"p":"topic","vt":"str"}],"repeat":"","crontab":"","once":false,"onceDelay":0.1,"topic":"","payload":"","payloadType":"date","x":410,"y":980,"wires":[["4aaa69609064511d"]]},{"id":"483c17544029e0de","type":"debug","z":"4d034605ed3b642c","name":"debug 48","active":true,"tosidebar":true,"console":false,"tostatus":false,"complete":"false","statusVal":"","statusType":"auto","x":740,"y":980,"wires":[]},{"id":"4aaa69609064511d","type":"function","z":"4d034605ed3b642c","name":"get time","func":"const now = new Date()\nmsg.payload = `${now.toISOString()}, Offset: ${now.getTimezoneOffset()}`\nreturn msg;","outputs":1,"timeout":0,"noerr":0,"initialize":"","finalize":"","libs":[],"x":580,"y":980,"wires":[["483c17544029e0de"]]}]

The RIO is set to EST and I am working remotely on it from CST. However, all other functions of these flows/dashboard seem to be working correctly (I.e. automated database insert is working properly at scheduled time)

Just ran a timestamp inject into a debug and this was the output

image

Edit: Sorry this is for an internal work thing and I am fairly new to node-red so I don’t feel comfortable loading a flow into it…I apologize for the inconvenience

The device shows the time set to 11:30 UTC, it is actually now 15:50 UTC.

Here is the configured device time settings

I suspect this is where the issue is coming from. Can you experiment by changing the “X-Axis Limit” to “Last 24 Hours” and see if anything plots please?

This did populate the chart, their line is down currently so i am waiting for it to get a cycle pulse.

Edit:

they are getting the cycle pulses displayed now but the bottom time is incorrect

In that case the time or zone in the browser is wrong.

It will be displaying the timestamp that is sent to the chart, there is no computation/adjustment made there at all within the chart itself.

@joepavitt Am I right in thinking that it will show the times using the timezone of the browser?

that was how it working before all of this started happening

I may be wrong in saying that it has to be the machine running the browser that has the problem, but there is a time setting issue problem somewhere. Put this in a function node

const now = new Date()
msg.payload = `${now.toISOString()}, Offset: ${now.getTimezoneOffset()}`
return msg;

Trigger it with an Inject node and feed it into a debug node and it will show you incontrovertibly what node-red thinks is the UTC time and what time zone it is.

It’s good point. It should just be displaying UTC, and the timestamp of the Node-RED server. Can I get you to open an issue on the repo please @CJS? We have just done a big re-work on the chart node to change the underlying library used to render, that may resolve an issue here, but if not, will give us a clearer idea on what’s going on.

I am not sure what you mean by that. I have a server running in UTC, with the current release of the dashboard, and I am viewing the dashboard from a machine in UTC+1. I have a chart with data being regularly appended. The time in the server is 09:05, but the local time in the browser is 10:05, which is the timestamp shown on the chart. I believe this is the correct behaviour.