Hello:
I am converting a chart from DB1 to DB2 and the timestamp doesn’t appear to be converted correctly. The same data displays correctly in DB1.
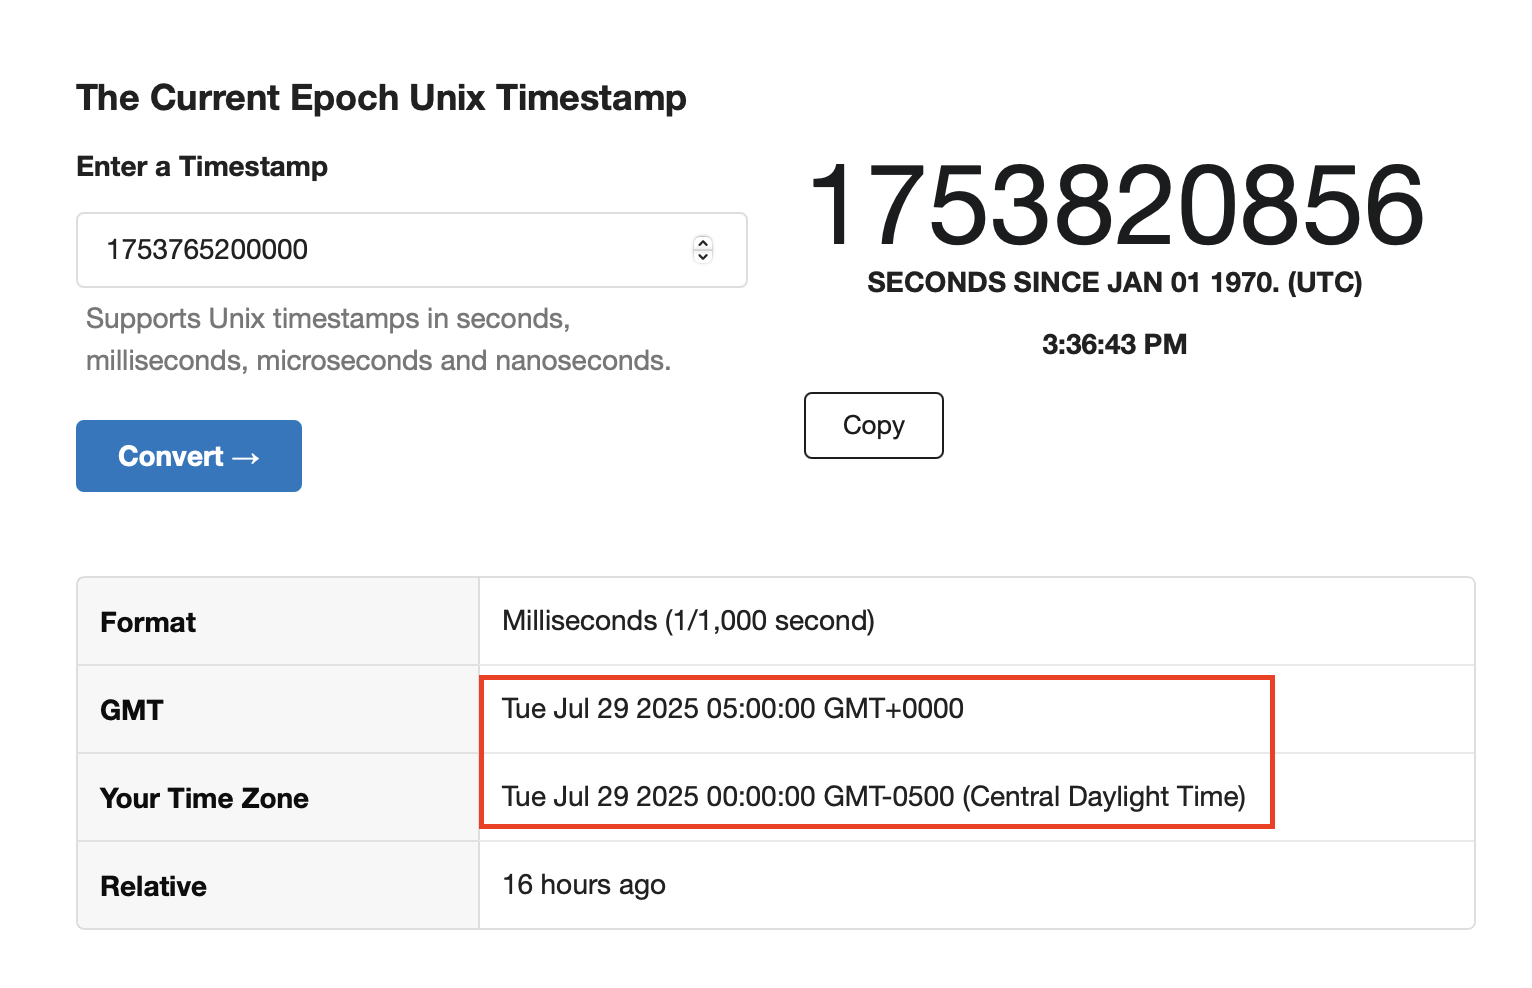
I have checked the timestamp data using epoch converter website and that looks correct.
Any help would be appreciated. Thanks
DB1 Chart:
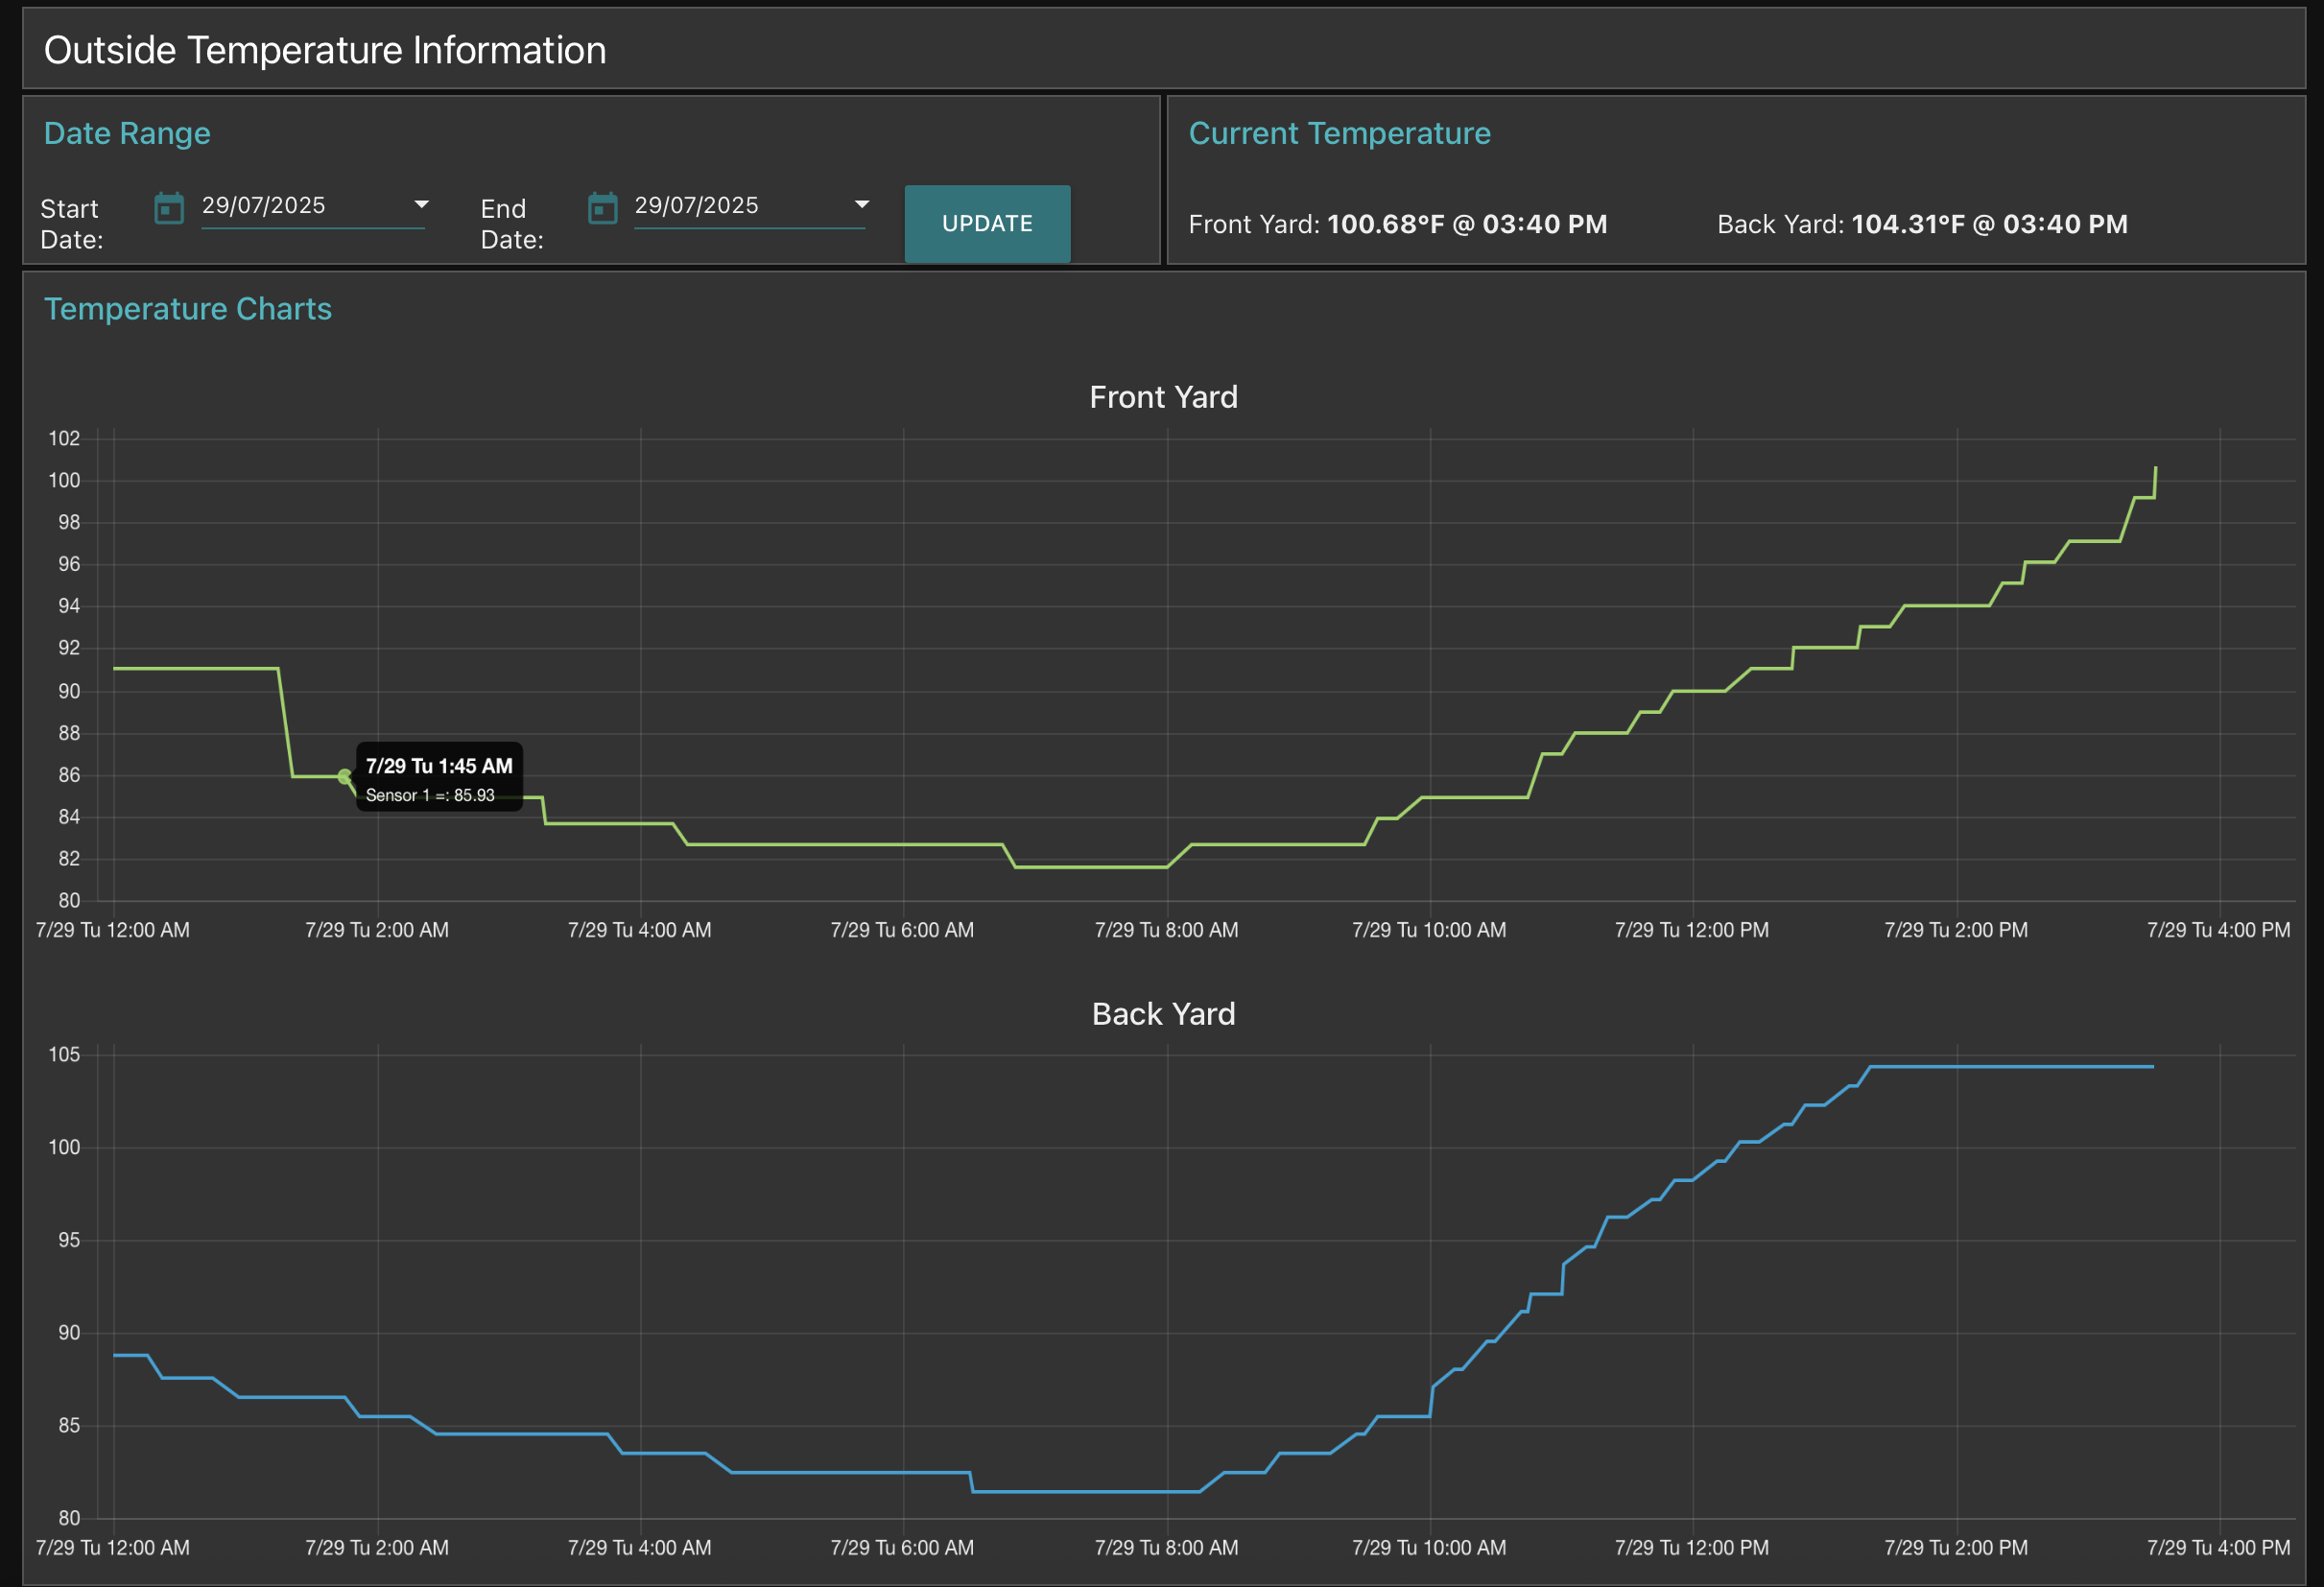
DB2 Chart:

Epoch converted time (for one data point):
Sample flow and data:
[{"id":"c43a8f4501d9ffa3","type":"inject","z":"0316cd25d00c5e0d","name":"","props":[{"p":"payload"},{"p":"topic","vt":"str"}],"repeat":"","crontab":"","once":false,"onceDelay":0.1,"topic":"","payload":"[{\"x\":1753765200000,\"y\":88.81},{\"x\":1753766100000,\"y\":88.81},{\"x\":1753766537000,\"y\":87.54},{\"x\":1753767000000,\"y\":87.54},{\"x\":1753767900000,\"y\":87.54},{\"x\":1753768634000,\"y\":86.53},{\"x\":1753768800000,\"y\":86.53},{\"x\":1753769700000,\"y\":86.53},{\"x\":1753770600000,\"y\":86.53},{\"x\":1753771500000,\"y\":86.53},{\"x\":1753771929000,\"y\":85.5},{\"x\":1753772400000,\"y\":85.5},{\"x\":1753773300000,\"y\":85.5},{\"x\":1753774026000,\"y\":84.49},{\"x\":1753774200000,\"y\":84.49},{\"x\":1753775100000,\"y\":84.49},{\"x\":1753776000000,\"y\":84.49},{\"x\":1753776900000,\"y\":84.49},{\"x\":1753777800000,\"y\":84.49},{\"x\":1753778700000,\"y\":84.49},{\"x\":1753779119000,\"y\":83.47},{\"x\":1753779600000,\"y\":83.47},{\"x\":1753780500000,\"y\":83.47},{\"x\":1753781400000,\"y\":83.47},{\"x\":1753782115000,\"y\":82.46},{\"x\":1753782300000,\"y\":82.46},{\"x\":1753783200000,\"y\":82.46},{\"x\":1753784100000,\"y\":82.46},{\"x\":1753785000000,\"y\":82.46},{\"x\":1753785900000,\"y\":82.46},{\"x\":1753786800000,\"y\":82.46},{\"x\":1753787700000,\"y\":82.46},{\"x\":1753788600000,\"y\":82.46},{\"x\":1753788706000,\"y\":81.43},{\"x\":1753789500000,\"y\":81.43},{\"x\":1753790400000,\"y\":81.43},{\"x\":1753791300000,\"y\":81.43},{\"x\":1753792200000,\"y\":81.43},{\"x\":1753793100000,\"y\":81.43},{\"x\":1753794000000,\"y\":81.43},{\"x\":1753794900000,\"y\":81.43},{\"x\":1753795595000,\"y\":82.46},{\"x\":1753795800000,\"y\":82.46},{\"x\":1753796700000,\"y\":82.46},{\"x\":1753797093000,\"y\":83.47},{\"x\":1753797600000,\"y\":83.47},{\"x\":1753798500000,\"y\":83.47},{\"x\":1753799190000,\"y\":84.49},{\"x\":1753799400000,\"y\":84.49},{\"x\":1753799789000,\"y\":85.5},{\"x\":1753800300000,\"y\":85.5},{\"x\":1753801200000,\"y\":85.5},{\"x\":1753801287000,\"y\":87.03},{\"x\":1753801886000,\"y\":88.04},{\"x\":1753802100000,\"y\":88.04},{\"x\":1753802785000,\"y\":89.57},{\"x\":1753803000000,\"y\":89.57},{\"x\":1753803684000,\"y\":91.1},{\"x\":1753803900000,\"y\":91.1},{\"x\":1753803983000,\"y\":92.11},{\"x\":1753804800000,\"y\":92.11},{\"x\":1753804882000,\"y\":93.64},{\"x\":1753805481000,\"y\":94.66},{\"x\":1753805700000,\"y\":94.66},{\"x\":1753806080000,\"y\":96.18},{\"x\":1753806600000,\"y\":96.18},{\"x\":1753807279000,\"y\":97.2},{\"x\":1753807500000,\"y\":97.2},{\"x\":1753807878000,\"y\":98.21},{\"x\":1753808400000,\"y\":98.21},{\"x\":1753809076000,\"y\":99.23},{\"x\":1753809300000,\"y\":99.23},{\"x\":1753809675000,\"y\":100.24},{\"x\":1753810200000,\"y\":100.24},{\"x\":1753810873000,\"y\":101.27},{\"x\":1753811100000,\"y\":101.27},{\"x\":1753811472000,\"y\":102.28},{\"x\":1753812000000,\"y\":102.28},{\"x\":1753812671000,\"y\":103.3},{\"x\":1753812900000,\"y\":103.3},{\"x\":1753813270000,\"y\":104.31},{\"x\":1753813800000,\"y\":104.31},{\"x\":1753814700000,\"y\":104.31},{\"x\":1753815600000,\"y\":104.31},{\"x\":1753816500000,\"y\":104.31},{\"x\":1753817400000,\"y\":104.31},{\"x\":1753818300000,\"y\":104.31},{\"x\":1753819200000,\"y\":104.31}]","payloadType":"json","x":259.64703369140625,"y":1525.96875,"wires":[["c94ef20ce474e42f"]]}] ````
