Assuming your image isn't a simple bitmap in a buffer (where you could calculate the offset to the pixel) you can use node-red-contrib-image-tools.
If you can have the X & Y position, you can get the colour using node-red-contrib-image-tools
Inject (X&Y) - image node (return image) - function node - debug
Function. ..
msg.image = msg.payload;
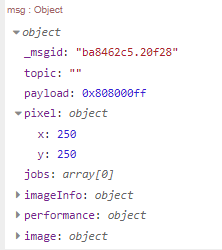
var x=msg.pixel.x;
var y=msg.pixel.y;
msg.payload = msg.image.getPixelColor(x, y); // returns the colour of that pixel e.g. 0xFFFFFFFF
return msg;
EDIT...
Example...
Flow...
[{"id":"a1dc1fe1.0cbe5","type":"inject","z":"1fbcaf1e.e73671","name":"{\"x\":250,\"y\":250}","topic":"","payload":"{\"x\":250,\"y\":250}","payloadType":"json","repeat":"","crontab":"0 0-22 * * *","once":false,"onceDelay":0.1,"x":150,"y":160,"wires":[["55c59618.0adb68"]]},{"id":"2377f26a.d9206e","type":"jimp-image","z":"1fbcaf1e.e73671","name":"","data":"http://www.sws.bom.gov.au/Images/HF%20Systems/Global%20HF/HAP%20Charts/San%20Francisco.gif","dataType":"str","ret":"img","parameter1":"img.png","parameter1Type":"str","parameter2":"","parameter2Type":"msg","parameter3":"","parameter3Type":"msg","parameter4":"","parameter4Type":"msg","parameter5":"","parameter5Type":"msg","parameter6":"","parameter6Type":"msg","parameter7":"","parameter7Type":"msg","parameter8":"","parameter8Type":"msg","parameterCount":0,"jimpFunction":"none","selectedJimpFunction":{"name":"none","fn":"none","description":"Just loads the image.","parameters":[]},"x":470,"y":160,"wires":[["b8a4eed2.52b58"]]},{"id":"b8a4eed2.52b58","type":"function","z":"1fbcaf1e.e73671","name":"","func":"msg.image = msg.payload;\nvar x=msg.pixel.x;\nvar y=msg.pixel.y;\nmsg.payload = msg.image.getPixelColor(x, y); // returns the colour of that pixel e.g. 0xFFFFFFFF\nreturn msg;\n","outputs":1,"noerr":0,"x":590,"y":160,"wires":[["5624b47d.dbf37c"]]},{"id":"55c59618.0adb68","type":"change","z":"1fbcaf1e.e73671","name":"","rules":[{"t":"set","p":"pixel","pt":"msg","to":"payload","tot":"msg"}],"action":"","property":"","from":"","to":"","reg":false,"x":330,"y":160,"wires":[["2377f26a.d9206e"]]},{"id":"85cd529d.73f19","type":"debug","z":"1fbcaf1e.e73671","name":"","active":true,"tosidebar":true,"console":false,"tostatus":false,"complete":"true","targetType":"full","x":830,"y":160,"wires":[]},{"id":"5624b47d.dbf37c","type":"image viewer","z":"1fbcaf1e.e73671","name":"","width":"300","data":"image","dataType":"msg","x":710,"y":160,"wires":[["85cd529d.73f19"]]}]


