flows.json (239.6 KB)
Too big a flow to include as a preview snippet here.
Note that we have got PRs opened, and in review, to hopefully fix all issues you’ve raised.
flows.json (239.6 KB)
Too big a flow to include as a preview snippet here.
Note that we have got PRs opened, and in review, to hopefully fix all issues you’ve raised.
The change has also had an impact on ui-template charts loading chart.js. (I also have ui-template charts loading echart.js which are OK)
If I check the chart is loaded using
        // Wait until the chart.js had been loaded, then draw chart
        async mounted() {
            await this.$nextTick()

            this.draw()

            this.isChartLoaded = true

        },
which prior to loading dashboard 2 v1.27 worked fine. I now get an error Uncaught (in promise) ReferenceError: Chart is not defined. So I tried;
 		mounted() {
	  		let interval = setInterval(() => {
				if (window.Chart) {
                    // The chart.js is loaded, so we can now use it
					clearInterval(interval)

		  			this.draw()

					this.isChartLoaded = true

				}

	  		}, 100)

		},
I now get error Uncaught Error: This method is not implemented: Check that a complete date adapter is provided. This also used to work.
This only seems to happen when I also have ui-charts on a page in the ui-base
Yikes! Thanks for catching this - I’m going to hold off on upgrading Flowfuse Dashboard to this version. I have Chart.js and eCharts.js versions of my charts (will probably only keep eCharts versions) but have ui-chart examples and tests for testing so things will definitely blow up!!
Oh man, okay, that’s a tricky migration I had not considered… Given that we no longer use the ChartJS library, it was removed a dependency. That may need some thinking on my part. I’ll put together something in the documentation on how to handle this. The workaround will be to include a load of the ChartJS script directly as we do with other third-party dependencies.
In good news though, I’ve got rendering of 1,000 data points down from 8 seconds to 73 milliseconds with the latest work today, fixes and release will go out tomorrow.
Hi Joe, the chart.js library is already being loaded as a dependency
<script src="https://cdn.jsdelivr.net/npm/chart.js"></script>
@Buckskin - I had noticed that even through I was explicitly loading the chart.js library (same source as you), I see this error in the console log
[Error] Failed to load resource: the server responded with a status of 404 () (chart.umd.min.js.map, line 0)
The charts work just fine, so I’ve been ignoring this but could this be somehow related?
That is just a "map" file for the library that you have loaded. Because you are loading a minimised library, your browser looks for matching map files that let it interpret things to a more meaningful location in the original source. The warning simply means that the library's author has not provided a map file.
Hi @ilkor - I’ll get that fixed now before I push the release out
ChartJS used to have a built-in automation for this, eCharts has no equivalent, so I’ve built our own, I’m fairly happy with it and have written tests to cover a range of charting y-values: Chart: Add in a smarter calculation for y-min and y-max, rather than defaulting to 0 by joepavitt · Pull Request #1844 · FlowFuse/node-red-dashboard · GitHub
@joepavitt - when I converted my charts to eCharts (using ui-template) and using multiple series, I had to find the min/max for each series and then use the min from the lowest value in all the series and the max as the highest value in all the series to get the charts to plot correctly (I set the min as -5 from the lowest value and max as +5 from the highest value).Just curious if the new ui-chart does this automatically.
I was a bit more in-depth about it, rather than just a +5/-5 as values could be of any range, I used log10 to get a rounding unit and went from there, you can see it in full here: node-red-dashboard/ui/src/widgets/ui-chart/helpers/axis.helper.js at c5aee11d41678044057064ef8175f25692a2ee08 · FlowFuse/node-red-dashboard · GitHub
This is in-review now, and should hopefully get merged/released today
Yep - my use case was for tracking temperature and lux values, so the +/- 5 range works since the range of values is much more limited.
There is an auto scaling option in eCharts (dataMin or dataMax) - that can use the min value or max value as y-axis scale, unless i misunderstand the issue.
Yes, but visually it’s not great. If you have data that fluctuates between say 3 and 9, a sensible axis limit there would be 0 > 10, not 3 > 9.
Or if your min is 0.1, but your max is 19.7, then forcing the axis min/max to these values makes gridlines behave very strange, hence I implemented a level of rounding.
1.27.1 has been released: node-red-dashboard (node) - Node-RED
This contains fixes for, I think, all problems raised here, and a few raised ont he GitHub repo too.
Looking good Joe, nice work. ![]()
Only except ....
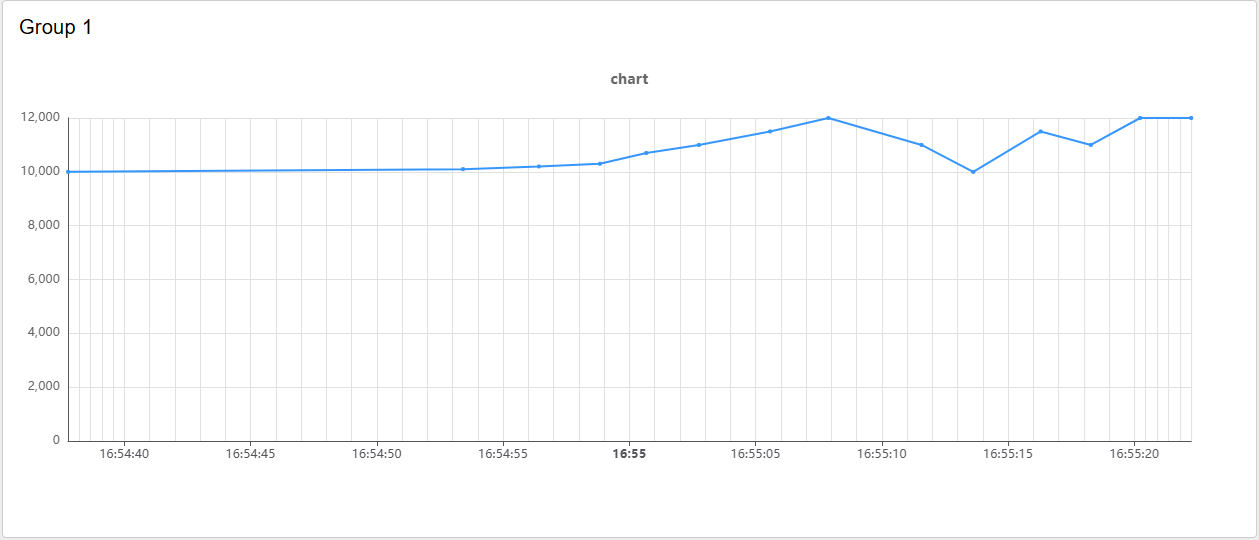
The date formatting of the x axis seems to have been borked in some cases (this is the single line chart in the flow I posted in #20 above)
The vertical grid lines on this chart now seem to be unevenly distributed mostly but not exclusively at the RHS (I think there may already be a github issue relating to "bunching" of grid lines?
(sorry!)
Were you using a custom time format? If so, apologies that you've hit the first ever breaking change I had to introduce to FF Dashboard, more details in the release notes:
The TLDR is that eCharts uses different tokens to ChartJS, and it would have been impossible for me to auto-convert the custom formats (I handled all the built in ones)
Link in the release notes to the new token format, it’s pretty much just wrap { } around the tokens in most cases.
There is indeed, I spent about an hour on it yesterday, and got no closer. Decided to park it and focus on the several other areas first. It’ll be something I revisit.
Copyright OpenJS Foundation and Node-RED contributors. All rights reserved. The OpenJS Foundation has registered trademarks and uses trademarks. For a list of trademarks of the OpenJS Foundation, please see our Trademark Policy and Trademark List. Trademarks and logos not indicated on the list of OpenJS Foundation trademarks are trademarks™ or registered® trademarks of their respective holders. Use of them does not imply any affiliation with or endorsement by them.
The OpenJS Foundation | Terms of Use | Privacy Policy | OpenJS Foundation Bylaws | Trademark Policy | Trademark List | Cookie Policy