Sorry about the delay replying...
Actually my charts do have titles but I redacted them, the ratio of chart to empty space is rather high regardless.
My guess is that the library helpfully provides some space around the chart to help with overall appearance. The dashboard does the same, resulting in excessive empty space?
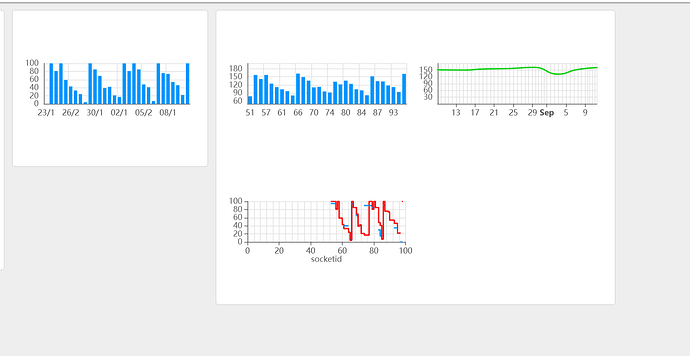
I have assembled a flow with simplified data to reproduce these features (which I do see on Chrome too):
[{"id":"9558fdf4065431aa","type":"tab","label":"Sample charts DB2","disabled":false,"info":"","env":[]},{"id":"748bdfd364666181","type":"ui-chart","z":"9558fdf4065431aa","group":"1fbd83493e9fd57a","name":"Trend Bar Chart","label":"Trend (Series: none)","order":1,"chartType":"bar","category":"","categoryType":"none","xAxisLabel":"","xAxisProperty":"id","xAxisPropertyType":"property","xAxisType":"category","xAxisFormat":"","xAxisFormatType":"auto","xmin":"","xmax":"","yAxisLabel":"","yAxisProperty":"value","yAxisPropertyType":"property","ymin":"0","ymax":"","bins":"","action":"replace","stackSeries":false,"pointShape":"star","pointRadius":"13","showLegend":true,"removeOlder":1,"removeOlderUnit":"3600","removeOlderPoints":"","colors":["#0095ff","#ff0000","#ff7f0e","#2ca02c","#a347e1","#d62728","#ff9896","#9467bd","#c5b0d5"],"textColor":["#666666"],"textColorDefault":true,"gridColor":["#e5e5e5"],"gridColorDefault":true,"width":"3","height":"4","className":"","interpolation":"linear","x":440,"y":140,"wires":[[]]},{"id":"1fde1dbee1985354","type":"ui-chart","z":"9558fdf4065431aa","group":"1fbd83493e9fd57a","name":"Chart 2 lines","label":"Chart 2 Lines","order":2,"chartType":"line","category":"[\"actual\", \"estimate\"]","categoryType":"json","xAxisLabel":"ID","xAxisProperty":"id","xAxisPropertyType":"property","xAxisType":"linear","xAxisFormat":"ccc","xAxisFormatType":"custom","xmin":"","xmax":"","yAxisLabel":"","yAxisProperty":"estimate","yAxisPropertyType":"property","ymin":"0","ymax":"100","bins":"","action":"replace","stackSeries":false,"pointShape":"circle","pointRadius":"2","showLegend":false,"removeOlder":1,"removeOlderUnit":"3600","removeOlderPoints":"","colors":["#0095ff","#ff0000","#ff7f0e","#2ca02c","#a347e1","#d62728","#ff9896","#9467bd","#c5b0d5"],"textColor":["#666666"],"textColorDefault":true,"gridColor":["#e5e5e5"],"gridColorDefault":true,"width":"3","height":"4","className":"","interpolation":"step","x":430,"y":180,"wires":[[]]},{"id":"0c31695fa013e5bc","type":"ui-chart","z":"9558fdf4065431aa","group":"1fbd83493e9fd57a","name":"Chart 1 line","label":"Chart 1 Line","order":3,"chartType":"line","category":"Data","categoryType":"str","xAxisLabel":"","xAxisProperty":"date","xAxisPropertyType":"property","xAxisType":"time","xAxisFormat":"dd MMM","xAxisFormatType":"custom","xmin":"","xmax":"","yAxisLabel":"","yAxisProperty":"value","yAxisPropertyType":"property","ymin":"","ymax":"","bins":"","action":"replace","stackSeries":false,"pointShape":"circle","pointRadius":"2","showLegend":false,"removeOlder":"52","removeOlderUnit":"604800","removeOlderPoints":"","colors":["#00cc00","#ff0000","#ff7f0e","#2ca02c","#a347e1","#d62728","#ff9896","#9467bd","#c5b0d5"],"textColor":["#666666"],"textColorDefault":true,"gridColor":["#e5e5e5"],"gridColorDefault":true,"width":"3","height":"4","className":"","interpolation":"smooth","x":430,"y":220,"wires":[[]]},{"id":"fe772e704fedff8c","type":"inject","z":"9558fdf4065431aa","name":"","props":[{"p":"payload"},{"p":"topic","vt":"str"}],"repeat":"","crontab":"","once":false,"onceDelay":0.1,"topic":"","payload":"[{\"id\":53,\"value\":157},{\"id\":56,\"value\":142},{\"id\":57,\"value\":157},{\"id\":58,\"value\":125},{\"id\":60,\"value\":112},{\"id\":61,\"value\":104},{\"id\":64,\"value\":97},{\"id\":65,\"value\":81},{\"id\":66,\"value\":162},{\"id\":67,\"value\":149},{\"id\":69,\"value\":136},{\"id\":70,\"value\":111},{\"id\":71,\"value\":113},{\"id\":72,\"value\":96},{\"id\":74,\"value\":92},{\"id\":77,\"value\":132},{\"id\":79,\"value\":122},{\"id\":80,\"value\":136},{\"id\":81,\"value\":124},{\"id\":83,\"value\":104},{\"id\":84,\"value\":100},{\"id\":85,\"value\":82},{\"id\":86,\"value\":152}]","payloadType":"json","x":130,"y":140,"wires":[["748bdfd364666181","86ce39c73c78cce7"]]},{"id":"10e612b7f61dfb28","type":"inject","z":"9558fdf4065431aa","name":"","props":[{"p":"payload"},{"p":"topic","vt":"str"}],"repeat":"","crontab":"","once":false,"onceDelay":0.1,"topic":"","payload":"[{\"date\":\"2025-08-09T04:40:55.000Z\",\"value\":151},{\"date\":\"2025-08-15T05:46:41.000Z\",\"value\":150},{\"date\":\"2025-08-18T00:52:05.000Z\",\"value\":154},{\"date\":\"2025-08-24T05:49:49.000Z\",\"value\":157},{\"date\":\"2025-08-29T08:09:49.000Z\",\"value\":162},{\"date\":\"2025-09-03T06:06:52.000Z\",\"value\":132},{\"date\":\"2025-09-07T06:20:30.000Z\",\"value\":152},{\"date\":\"2025-09-11T09:29:10.000Z\",\"value\":161}]","payloadType":"json","x":130,"y":220,"wires":[["0c31695fa013e5bc"]]},{"id":"13b5d93e41818699","type":"inject","z":"9558fdf4065431aa","name":"Clear","props":[{"p":"payload"},{"p":"topic","vt":"str"}],"repeat":"","crontab":"","once":false,"onceDelay":0.1,"topic":"","payload":"[]","payloadType":"json","x":130,"y":100,"wires":[["748bdfd364666181","1fde1dbee1985354","0c31695fa013e5bc"]]},{"id":"1b8470cbf1c2c973","type":"ui-template","z":"9558fdf4065431aa","group":"","page":"2829018fcc16e5b2","ui":"","name":"Red Outline Widget","order":0,"width":0,"height":0,"head":"","format":".nrdb-ui-widget {\n border: 1px solid red;\n}","storeOutMessages":true,"passthru":true,"resendOnRefresh":true,"templateScope":"page:style","className":"","x":450,"y":100,"wires":[[]]},{"id":"0d7458f5202ee143","type":"inject","z":"9558fdf4065431aa","name":"","props":[{"p":"payload"},{"p":"topic","vt":"str"}],"repeat":"","crontab":"","once":false,"onceDelay":0.1,"topic":"","payload":"[{\"id\":56,\"estimate\":81,\"actual\":null},{\"id\":57,\"estimate\":100,\"actual\":null},{\"id\":58,\"estimate\":59,\"actual\":null},{\"id\":60,\"estimate\":43,\"actual\":null},{\"id\":61,\"estimate\":33,\"actual\":40},{\"id\":64,\"estimate\":24,\"actual\":null},{\"id\":65,\"estimate\":4,\"actual\":5},{\"id\":66,\"estimate\":100,\"actual\":95},{\"id\":67,\"estimate\":85,\"actual\":85},{\"id\":69,\"estimate\":69,\"actual\":65},{\"id\":70,\"estimate\":39,\"actual\":null},{\"id\":71,\"estimate\":42,\"actual\":40},{\"id\":72,\"estimate\":21,\"actual\":null},{\"id\":74,\"estimate\":17,\"actual\":90},{\"id\":77,\"estimate\":100,\"actual\":90},{\"id\":79,\"estimate\":81,\"actual\":85},{\"id\":80,\"estimate\":100,\"actual\":null},{\"id\":81,\"estimate\":85,\"actual\":null},{\"id\":83,\"estimate\":48,\"actual\":30},{\"id\":84,\"estimate\":41,\"actual\":15},{\"id\":85,\"estimate\":7,\"actual\":null},{\"id\":86,\"estimate\":100,\"actual\":90},{\"id\":87,\"estimate\":76,\"actual\":null},{\"id\":89,\"estimate\":74,\"actual\":null},{\"id\":90,\"estimate\":54,\"actual\":null},{\"id\":93,\"estimate\":46,\"actual\":35},{\"id\":95,\"estimate\":22,\"actual\":null},{\"id\":97,\"estimate\":null,\"actual\":0},{\"id\":98,\"estimate\":100,\"actual\":null},{\"id\":99,\"estimate\":90,\"actual\":85}]","payloadType":"json","x":130,"y":180,"wires":[["1fde1dbee1985354"]]},{"id":"86ce39c73c78cce7","type":"ui-chart","z":"9558fdf4065431aa","group":"1fbd83493e9fd57a","name":"Trend Series: id, no legend","label":"Trend (Series: id, no legend)","order":4,"chartType":"bar","category":"id","categoryType":"property","xAxisLabel":"","xAxisProperty":"id","xAxisPropertyType":"property","xAxisType":"category","xAxisFormat":"","xAxisFormatType":"auto","xmin":"","xmax":"","yAxisLabel":"","yAxisProperty":"value","yAxisPropertyType":"property","ymin":"0","ymax":"","bins":"","action":"replace","stackSeries":false,"pointShape":"star","pointRadius":"13","showLegend":false,"removeOlder":1,"removeOlderUnit":"3600","removeOlderPoints":"","colors":["#0095ff","#ff0000","#ff7f0e","#2ca02c","#a347e1","#d62728","#ff9896","#9467bd","#c5b0d5"],"textColor":["#666666"],"textColorDefault":true,"gridColor":["#e5e5e5"],"gridColorDefault":true,"width":"3","height":"4","className":"","interpolation":"linear","x":480,"y":260,"wires":[[]]},{"id":"1fbd83493e9fd57a","type":"ui-group","name":"Test","page":"2829018fcc16e5b2","width":"10","height":1,"order":1,"showTitle":true,"className":"rededge","visible":"true","disabled":"false","groupType":"default"},{"id":"2829018fcc16e5b2","type":"ui-page","name":"Test","ui":"a3e614cd9df4ae2e","path":"/test","icon":"home","layout":"grid","theme":"b892be9ce6f645f6","breakpoints":[{"name":"Default","px":"0","cols":"3"},{"name":"Tablet","px":"576","cols":"6"},{"name":"Small Desktop","px":"768","cols":"9"},{"name":"Desktop","px":"1024","cols":"12"}],"order":1,"className":"","visible":"true","disabled":"false"},{"id":"a3e614cd9df4ae2e","type":"ui-base","name":"My Dashboard","path":"/dashboard","includeClientData":true,"acceptsClientConfig":["ui-notification","ui-control"],"showPathInSidebar":false,"navigationStyle":"default","titleBarStyle":"default"},{"id":"b892be9ce6f645f6","type":"ui-theme","name":"Default Theme","colors":{"surface":"#ffffff","primary":"#0094ce","bgPage":"#eeeeee","groupBg":"#ffffff","groupOutline":"#cccccc"},"sizes":{"pagePadding":"12px","groupGap":"12px","groupBorderRadius":"4px","widgetGap":"5px","density":"default"}},{"id":"0deb3e5eb47a5dff","type":"global-config","env":[],"modules":{"@flowfuse/node-red-dashboard":"1.27.0"}}]
Side note: In the above rendering, most but not all nodes have default names rather than the actual name.
The starting from zero thing seems to apply to the y axis too, when no min and max value is specified. Previous dashboards/versions chose based on the data.
I can get multiple colour bars in the "Trend" chart by changing Series from none to key: id. The result is unusable though because the bars are ~1px wide.
I think v1.26 did this too, using Series: none was a work-around.
Are your test flows for the change of library available to download Joe?


