Hi everyone.
I'm struggling with ui-charts in dashboard 2.0. I want to plot values in different days.
This is the chart
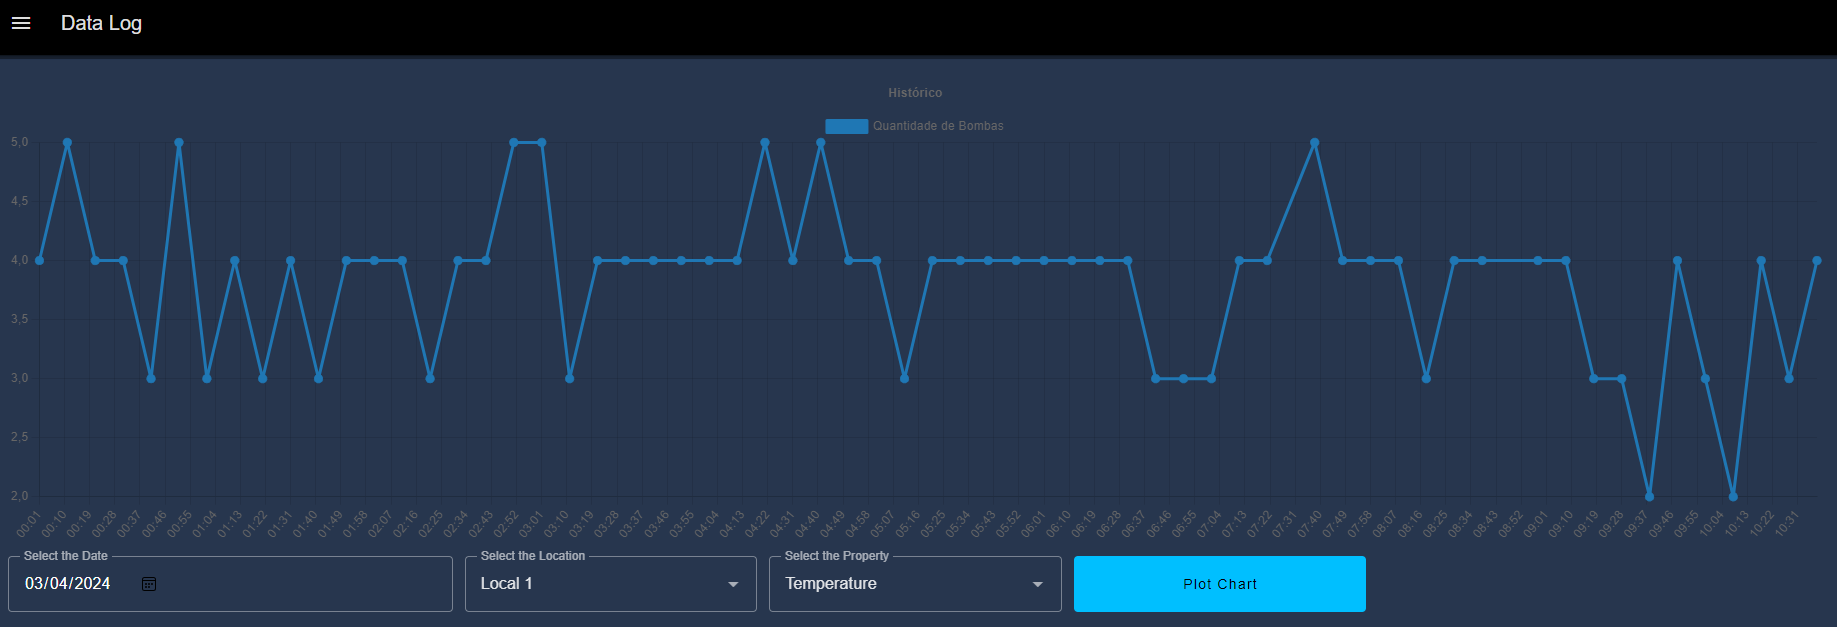
I read a SQL data and parse a json to ui-chart node. There is a example:
"topic": "Temperatura",
    "payload": [{
        "x": "00:01",
        "y": 34.391273498535156
    }, {
        "x": "00:11",
        "y": 33.84150695800781
    }, {
        "x": "00:21",
        "y": 33.84150695800781
    }, {
        "x": "00:31",
        "y": 34.03862762451172
    }, {
        "x": "00:41",
        "y": 33.740234375
    }, {
        "x": "00:51",
        "y": 33.49066925048828
    }, {
        "x": "01:01",
        "y": 33.44184112548828
    }, {
        "x": "01:11",
        "y": 33.440032958984375
    }, {
        "x": "01:21",
        "y": 33.93916320800781
    }, {
        "x": "01:31",
        "y": 34.33702087402344
    }, {
        "x": "01:41",
        "y": 34.28819274902344
    }, {
        "x": "01:51",
        "y": 33.839698791503906
    }, {
        "x": "02:01",
        "y": 34.23755645751953
    }, {
        "x": "02:11",
        "y": 34.541378021240234
    }, {
        "x": "02:21",
        "y": 34.58839797973633
    }, {
        "x": "02:31",
        "y": 34.28819274902344
    }, {
        "x": "02:41",
        "y": 34.34063720703125
    }, {
        "x": "02:51",
        "y": 34.59020233154297
    }, {
        "x": "03:01",
        "y": 34.391273498535156
    }, {
        "x": "03:11",
        "y": 34.19053649902344
    }, {
        "x": "03:21",
        "y": 34.040435791015625
    }, {
        "x": "03:31",
        "y": 33.84150695800781
    }, {
        "x": "03:41",
        "y": 33.591941833496094
    }, {
        "x": "03:51",
        "y": 33.59013366699219
    }, {
        "x": "04:01",
        "y": 33.537689208984375
    }, {
        "x": "04:11",
        "y": 33.689598083496094
    }, {
        "x": "04:21",
        "y": 34.14170837402344
    }, {
        "x": "04:31",
        "y": 34.19053649902344
    }, {
        "x": "04:41",
        "y": 33.986183166503906
    }, {
        "x": "04:51",
        "y": 34.03681945800781
    }, {
        "x": "05:01",
        "y": 34.08745574951172
    }, {
        "x": "05:11",
        "y": 34.040435791015625
    }, {
        "x": "05:21",
        "y": 34.03862762451172
    }, {
        "x": "05:31",
        "y": 33.689598083496094
    }, {
        "x": "05:41",
        "y": 33.494285583496094
    }, {
        "x": "05:51",
        "y": 32.94089889526367
    }, {
        "x": "06:01",
        "y": 32.78718185424805
    }, {
        "x": "06:11",
        "y": 32.48878860473633
    }, {
        "x": "06:21",
        "y": 32.438148498535156
    }, {
        "x": "06:31",
        "y": 32.34230041503906
    }, {
        "x": "06:41",
        "y": 32.43995666503906
    }, {
        "x": "06:51",
        "y": 32.74016189575195
    }, {
        "x": "07:01",
        "y": 32.58824920654297
    }, {
        "x": "07:11",
        "y": 33.090999603271484
    }, {
        "x": "07:21",
        "y": 33.440032958984375
    }, {
        "x": "07:38",
        "y": 33.38939666748047
    }, {
        "x": "07:48",
        "y": 33.68778991699219
    }, {
        "x": "07:58",
        "y": 33.888526916503906
    }, {
        "x": "08:08",
        "y": 33.738426208496094
    }, {
        "x": "08:18",
        "y": 33.092811584472656
    }, {
        "x": "08:28",
        "y": 32.991539001464844
    }, {
        "x": "08:38",
        "y": 33.14344787597656
    }, {
        "x": "08:58",
        "y": 32.93728256225586
    }, {
        "x": "09:08",
        "y": 33.03855514526367
    }, {
        "x": "09:18",
        "y": 32.68952560424805
    }, {
        "x": "09:28",
        "y": 32.69133377075195
    }, {
        "x": "09:38",
        "y": 32.94089889526367
    }, {
        "x": "09:48",
        "y": 32.89026641845703
    }, {
        "x": "09:58",
        "y": 32.78899002075195
    }, {
        "x": "10:08",
        "y": 32.69314193725586
    }],
I parse the "X" value as "time of day" because I cant send date. Date dont plot at all.
I want to parse the date that a user pick from the "datepicker", any tips?
just replace the x for a "date timestamp" ou "date localString" dont work.
taking only the time of day like Im doing isnt great because the label (mouse hover the date in chart) dont match the correct day (only show actual date)