In the beginning, in my cursory searches for visualizing MQTT data from IoT devices, I ran across Node-Red and the Node-Red dashboards. It led me to using the v1 dashboard. I’ve built about a dozen flows using it and frankly it has worked flawlessly. I could have asked for a few bells and whistles, but was willing to live with it. Until…
It was suggested that I should move to FlowFuse, Dashboard 2. Well, now that I know such a beast exists, I gave it a try. I simply installed the module and added a chart to an existing flow and pushed the data as modified for Dashboard 1 charts and it failed. I re-massaged the data format and got something to show. All well and good.
The issue I’m finding, Deploying is taking more than a minute and looking at my 8GB Raspberry Pi 4 server, I see the CPU is constantly running 25 to 30% even when I’m not deploying. Triggering an MySQL data retrieval that fills the charts with 1400 data points takes tens of seconds with v2 and a blink of an eye with a v1 chart. As soon as I deleted all node instances applicable to FlowFuse and removed the module, the server returned to 0 to 1% CPU load and the Deploys and data fetches were near instant again.
Surely, this can not be considered acceptable behavior, so I must be doing something wrong. Any suggestions?
I have been on vacation for last 2 weeks but will get it released in the coming days. Please hang fire.
In the meantime, it makes sense to reduce the amount of points a chart can physically occupy in pixels (e.g. if your screen is 1080 pixels across and you are displaying a chart that covers half of the screen then it makes little sense to show any more than 540 pixels.
A new release of Dashboard 2 is not going to fix this.
I suspect you may have a runaway loop.
Looking at the flow diagram in your other post (I didn't download it since your issue seemed to be resolved), I see there is indeed a feedback loop.
Drawing charts with more data points than pixels is also a common cause of problems. I think it manifests as excessive memory use by the browser, and especially if you are using a browser on your Pi rather than another device.
1400 points is not outrageous though, I don't think it would be noticeable.
I do wish the chart node had a way to zoom in/out of large data sets without plotting thousands of points.
Grafana has this, I've not really explored it since like you I use MySQL rather than Influxdb.
It may do, depending on what @Inq's flow did when the problem appeared. The bug in the existing dashboard is that if new data are added in Replace mode, the old data are not deleted, so if new data are added multiple times then the browser or server may become overloaded, giving the problems described. That is why I asked whether the problem appeared immediately.
However, if there were only 1400 points being added each time then the problem would not appear unless there were many updates to the chart, so you may well be correct and there is something else going on.
Although this is a 1080P screen grab, my desktop is a 4K screen. I also want to see the data at full resolution of 1/minute over the past 24 hours => 1440 points. Using Dashboard V1 this screen does take a longish 2 seconds (but quite acceptable) to show up the first time, but it is also fed histogram style and these updates take no discernable time.
msg.topic =
    "SELECT 0 as id, datetime, temperature FROM " +
    "Outside WHERE datetime > NOW() - INTERVAL 1 DAY " +
    "UNION " +
    "SELECT 3 as id, datetime, temperature FROM " +
    "Inside WHERE datetime > NOW() - INTERVAL 1 DAY " +
    "UNION " +
    "SELECT 1 as id, datetime, temperature FROM " +
    "Attic WHERE datetime > NOW() - INTERVAL 1 DAY " +
    "UNION " +
    "SELECT 2 as id, datetime, temperature FROM " +
    "Crawlspace WHERE datetime > NOW() - INTERVAL 1 DAY;";
return msg;
For longer duration graphs (1 month, 1 year, etc) I do MySQL averaging so there are actually fewer data points.
I kind of did a knee jerk reaction to seeing the CPU usage and was relieved when I removed the V2 and it went back to normal. I will do some controlled and see where things start going sideways.
I really appreciate everyone’s help during my learning curve.
Before I add the FlowFuse module, I should summarize what I have in case someone sees something up front. I should note, all this works just fine using the V1 dashboard while showing no discernable lag after the initial loads.
I should first describe my computer architecture. The server is a headless 8GB Rasp4. It runs a MQTT Broker, Node-Red and MySQL. All my work via Chrome browsers are on various Windows PC’s. This screen grab on a Windows 10 laptop shows a view of the server in RealVNC viewer showing the RasPi happily running at zero percent. In the background, the highest density graph is running on a Chrome tab on the Windows machine.
I would ask - when do actions occur? For instance: when I display a tab of a flow with many graphed data points, I have a short pause on the order of a second or two. This tells me the flow gets run when I access it via a dashboard tab. On the other hand, many of the same flows do three things - take the incoming data from MQTT feeds (1) post to the MySQL database (2) add a data point to a graph and (3) buffers a running tally for other longer term graphs. This tells me the flows run in the background even when nothing is displaying them.
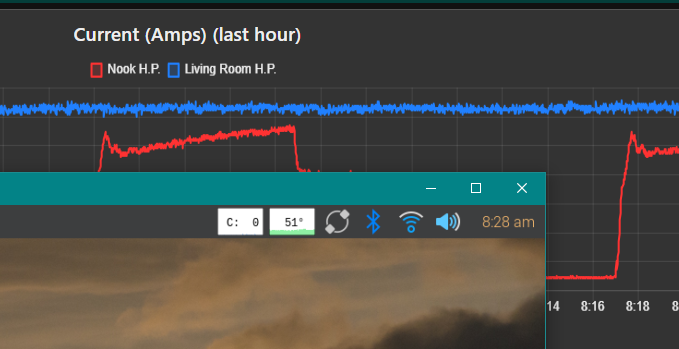
If 1440 points causes a concern, then this one will certainly make you go non-linear. This screen has three charts showing the same data on three time scales. It is fed by two power current meters on two of house’s Mini-Split heat pumps. The top chart has data points (1/second) over the last hour => 3600 x 2. The second chart has data points (1/minute) over the last 24 hours => 1440 x 2. The third chart has data points (1/hour) over the last month => 744 x 2.
Over the dozen tabs I have on the dashboard, I have charts displaying a total of 58 thousand data points. This shows no discernable lag during deployments or during runtime except for a couple of second pause when first showing a tab. During a node-red-start, there is a 5 second timeframe while the RaspPi peaks at 60%. When displaying the Power tab, there is a 2 second period where the RaspPi peaks at 11% before the Windows laptop displays the tab and the RaspPi returns to zero.
Now, I’ll proceed to bring in FlowFuse and try again.
When updates come out, does the Node-RED editor automatically update or prompt me or does one have to know that an update is available and update?
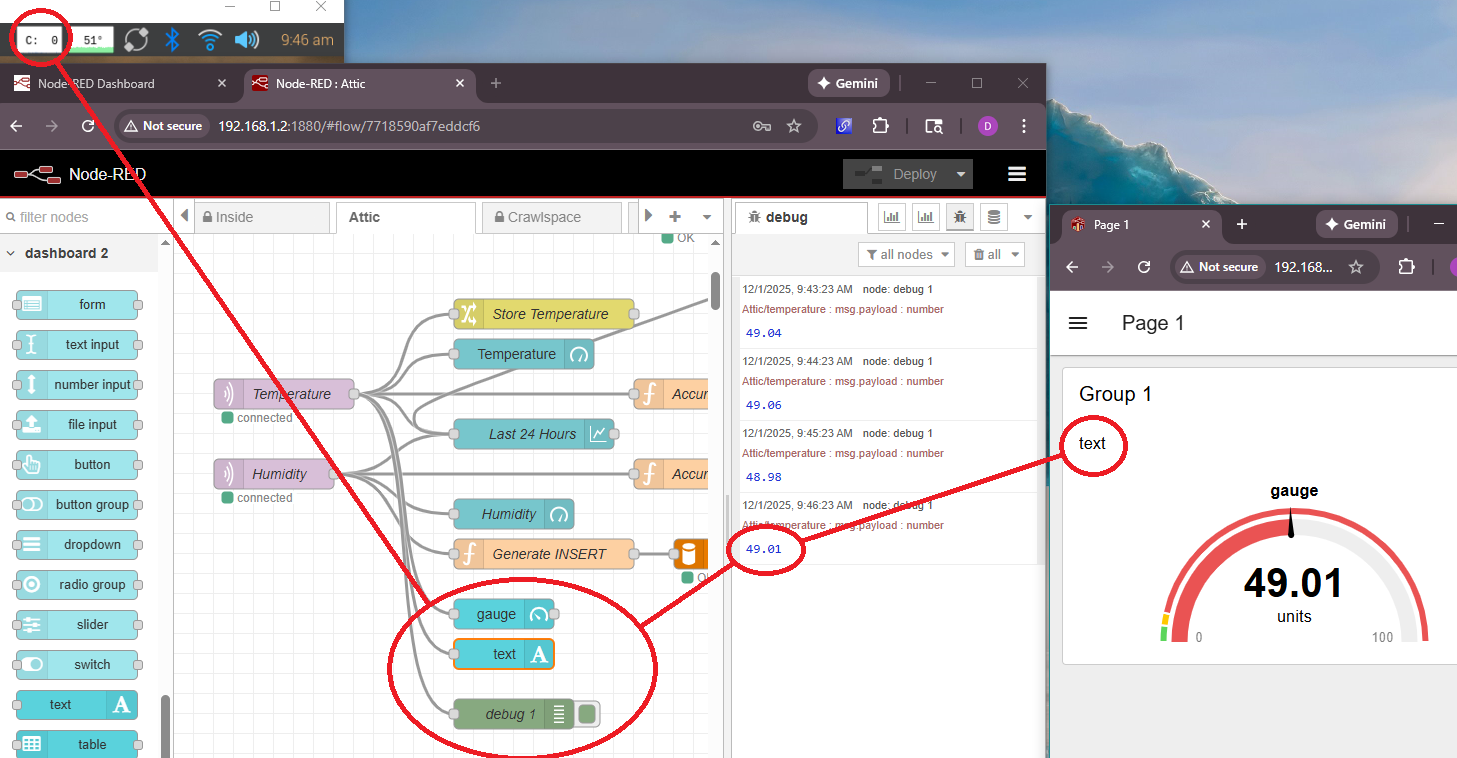
I’ve installed FlowFuse already and I started a little simpler a single text box and gauge from an MQTT node. CPU utilization is fine so far, but the text box doesn’t update.
BTW, I appreciate the work that goes into supporting free software. I have my own package out that does a lot of the same type things as Node-Red and Dashboard on a far smaller scale. It typically becomes a bad experience for the developer and the satisfaction/pain ratio goes down till it is abandoned. I plan on letting my URL/hosting lapse next time around and I’ve abandoned using it compared to Node-Red for IoT projects. I now only use it for some real time cases like RC of a robot. https://inqonthat.com/inqportal-the-three-line-promise/
I just dropped it on the flow. It created the page, group and was set to msg.payload.
Ooops! I just re-checked, its set to msg.payloads. Once I took off the s, it worked. I read the Help and it doesn’t say anything about “msg.payloads”. Does it have some functionality I’m missing? It doesn’t seem consistent with most nodes using msg.payload as the default.
This is a known bug and will probably be fixed for the next release (no idea when that will be!)
I think you only get a notification of available updates if your settings.js file has a telemetry section with enabled: true and updateNotification: true
Hi Colin, I also realized at Github that you have put lots of effort for adding support for access to eCharts options via msg.ui_update. Does that really mean what I think. Does that mean we gain access to all options of echarts or are there any restrictions ? Can't wait to test this new feature. Any idea when the update will be released ?
Yes it does mean that, if my code is accepted. No restrictions, you will be free to completely mess up the chart by setting inappropriate options. I have coded it and posted a PR. It now needs to be reviewed, and if the core team is happy with the way I have done it then I will just need to update the docs. There is a shortage of manpower availability in the team at the moment though, so I don't know when that will be. If this is important to you then post a comment on the original issue In ui-chart allow setting echarts options via msg.ui_update? · Issue #1832 · FlowFuse/node-red-dashboard · GitHub
[Edit] When I said I don't know when that will be, I meant the review. Once it is accepted I will do the docs quickly.
I just realized that the dashboard has been updated to 1.30.0 and, indeed, your approach has been implemented ( eCharts options via msg.ui_update), which I’m very glad to hear. For the start, do you have a minimum working example for us in order to assess how this generally works ? Thanks a lot again...