How to get errors/exceptions while developing custom node?

Hi folks,

I struggle to get decent error messages while writing a custom node (searched the forum and internet, not much to find, so I come up with this topic! o) If I enter some garbage lines of code like this:

module.exports = function(RED) {
    "use strict";
    some garbage / # _ {};
...

All I get is this:

Welcome to Node-RED
===================
29 Mar 15:13:55 - [info] Node-RED version: v0.20.5
29 Mar 15:13:55 - [info] Node.js  version: v10.16.0
29 Mar 15:13:55 - [info] Linux 4.14.79-v7+ arm LE
29 Mar 15:13:56 - [info] Loading palette nodes
29 Mar 15:14:00 - [info] Dashboard version 2.15.4 started at /ui
29 Mar 15:14:01 - [warn] ------------------------------------------------------
29 Mar 15:14:01 - [warn] [node-red-node-xmpp/xmpp] SyntaxError: Unexpected identifier
29 Mar 15:14:01 - [warn] ------------------------------------------------------
..

No line information, no file name, just a warning, but at least "something". But things get even worse if there is an exception in slightly deeper levels, like in this event handler. The log window will show absolutely nothing about it.

RED.events.on('nodes-started',function() {
        console.log('****** All nodes have started ****** - IN');
        throw "lets test it!";
});

I did printf-style debugging, line by line, but this is getting old now.
What's the professional way of doing what I do? Despite the missing log output, I'am thinking of an IDE in the long run, but I would be fine with getting some errors for now, so let's concentrate on that if possible. o)

Thank you! o)

Have you tried setting log level to trace in settings.js ?

Also what IDE are you using? Surely the problems window highlights an issue in your code?

Yes, I know the feeling...

I have developed my own workaround. But it is rather unorthodox and I have no clue whether it works on all platforms!!!! However it works fine on my Raspberry.

After I install a new version of Node-RED, I always add an extra console log line to the Node-RED code, where the nodes are being loaded and parsed (/usr/lib/node_modules/node-red/node_modules/@node-red/registry/lib/loader.js), in the loadNodeSet function:

image

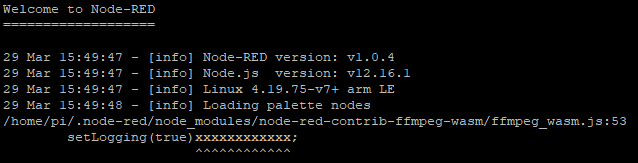
Now suppose I have an error in one of my custom nodes:

image

Then at startup I see at least where it is going wrong:

image

Not a very elegant solution, but it has saved me lots of time guessing about what is going wrong ...
P.S. I also think it doesn't report all errors, but I'm not sure at the moment.

1 Like

Bart, why not console.error(err) - off the top of my head, error function outputs a stack trace with line numbers etc too doesn't it?

If at any time anyone wants to contribute enhancements to the core that improves the debugging of nodes, or helps surface errors that are otherwise being masked, then they would be welcome.

Hey Nick,
Problem is that I "think" it doesn't work well in all conditions. If I'm not mistaken it doesn't work the same way e. g. when a line only contains xxxxxx without other code. But it is too long ago. I should test some different cases to be sure...

Ok, i tried the "trace" level in settings.js, unfortunately this does not help with the exceptions.
Then I added console.error(err) (suggested by you @Steve-Mcl ) to the loader.js file suggested by you, @BartButenaers.

The exception was printed to the log, including filename and line information. This is a start! o)

Weird though, after setting the log level back to "info" and removing the console.error(err) line as well. The exception was still visible in the log. The node-red service now seems to fail and restart in a loop with my test-exception (which wasn't the case before).

Mhh.. anyway, thanks guys! o) I will drop the synthetic exceptions for now, and see how things work out in a real dev-session, with real human errors. o) But for today I'm done, I managed to fork another existing node and add expression resolving to it, to make node-configuration and deployment to different environments possible.
image
(Something I posted a while back, still need this and wish something like this to be native, see link:)
https://discourse.nodered.org/t/support-msg-foobar-for-dynamic-input-in-node-editor/17500

@Steve-Mcl
IDE-wise, I don't use any. I use a regular editor. It highlights bad syntax of course, but the runtime errors it surely won't highlight upfront (off-by-one errors, null objects at runtime). NR would just go silent on me until now, I then added log outputs every 5 lines to track the location down. Quite inefficient! o)

But whatever IDE, is there an environment which would allow to use a state of the art debugger and code stepper? I can do it old school, but I'm quite spoiled with breakpoints and things. o)

Thanks again, have a nice Sunday! o)

1 Like

I use VSCode (as do the Devs of node-red - I think)

Yes you can debug step your server side code.

For client side, put debugger statements in your code and open dev tools F12.

See this...

Hey Nick (@knolleary),
Did a few tests to refresh my old memory.

  • SyntaxError: as in my example above (setLogging(true)xxxxxxxxxxx;) the require statement throws a syntax error:

    image

    The error contains the line number (and code snippet):

    So that would be useful information for developers.

  • ReferenceError: when I call an undefined function in my code

    image

    Then the 'require' function does NOT throw an error. Instead I only get that reference error as soon as the faulty statement is being executed:

    Which is being catched here:

    image

    At that point all information is also available (line number ...), but e.g. the line number doesn't show up in the log of the starting flow:

In the NodeJs Error API they indeed only mention syntax errors in case of code evaluation:

Therefore I think this should be updated in (at least) these two catch blocks. Is that ok for you? And which information/format should be displayed?

Thanks !

@Steve-Mcl
Thank you, this is useful information. I'm running NR on a Pi3, not sure VisualStudioCodes runs well on it. VSCode is slow as f*** on a regular computer already, but I might give it a try! Thank you! o)

This actually is expected behaviour (from a javascript engine at least).

You don't have to run VSCode on the pi (although you probably can)

Do you node development on a better machine then install the finished package on your pi.

You can then do remote debugging.

This is the workflow most do.

Consider this, many (probably 99%) of the nodes we use work on a pi, I don't imagine many (perhaps any) of them were fully developed in the pi itself!

See this example of remote debugging nodejs running on pi (from 2016 - it may be different nowadays).

Its plenty quick on my desktop. A little slower on my laptop and dev VM - however - the benefits of multi cursor editing, debug step, refactoring, git integration + really really useful add ins FAR outweighs the occasional slowness.

This topic was automatically closed 60 days after the last reply. New replies are no longer allowed.