Hi,
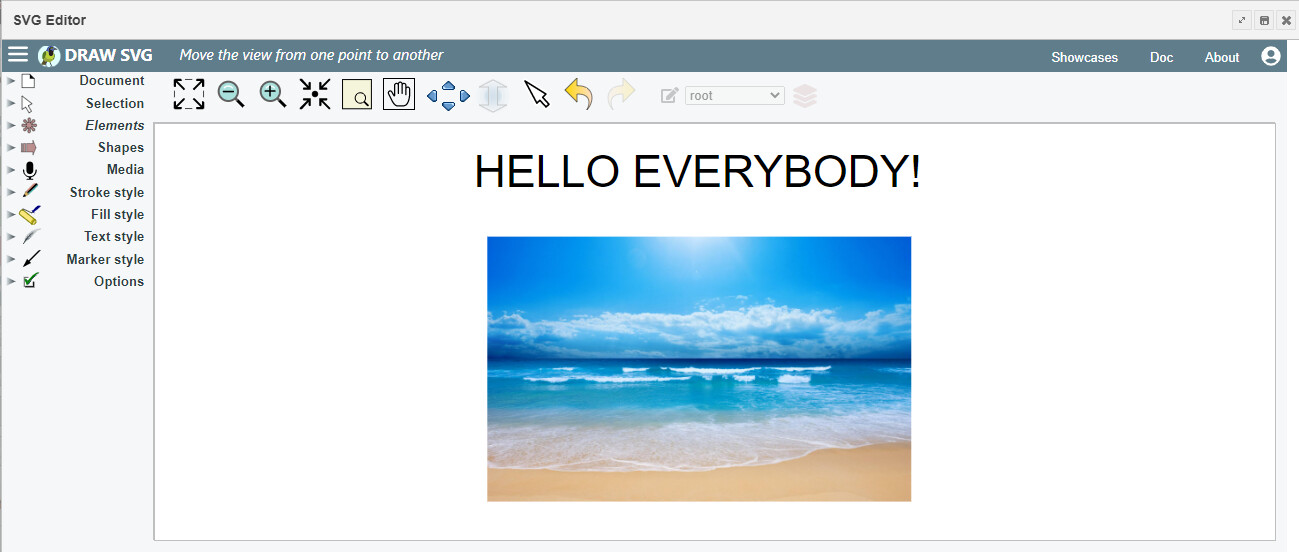
I used svg graphics to draw and display in dashboard. But the display don't like as I want. I draw in SVG Editor then I save and watch in dashboard. I didn't see the letters. Please see the attached pictures.
If you know, please help me. Thank you very much!

Is it possible that your ui_tab / ui_group is too small?
You can check this in the layout of your tab see picture

Because the picture isn't displayed as whole as well.
Thank you very much! I already edit the size in group. I feel the picture is not in the position I wanted.
Does this tutorial help? I assume there is a problem with your x, y, width, height or viewbox attribute of your svg.
I am also in the same situation as you.
Not sure if I understand you correctly. I have written that tutorial at the time being, to help users getting started. Is it of any help to you?
You can always export the svg part of your flow and share it here, if you need help...
Oh, I am sorry. I didn't understand your first reply and now I clear.
Thank you very much.