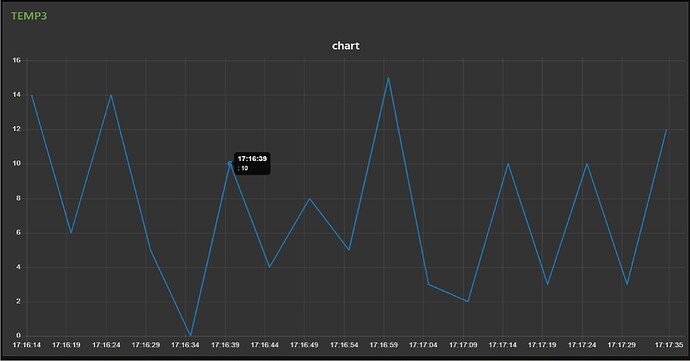
I can't see the result of a select from sql server in a line graph, what can I do?
Welcome to the forum @ultim0
Are you trying to use the chart node from node-red-dashboard? If so then this page shows you how to format the data for passing to the chart. node-red-dashboard/Charts.md at master · node-red/node-red-dashboard · GitHub
I don't know if you are a beginner with node-red, but if so then I recommend watching this playlist: Node-RED Essentials. The videos are done by the developers of node-red. They're nice & short and to the point. You will understand a whole lot more in about 1 hour. A small investment for a lot of gain.
Hello,
yes i am a beginner, thanks for the videos i will watch them.
But could you give me some suggestions on how to do it?
thank you
I have posted a link showing how to format the data, and linked to videos that will provide lots of information that will help you. How many more suggestions to you need?
When you have watched the videos and read the link, if you are still stuck come back with specific questions about exactly what you need help with.
[{"id":"83e0e297.8b857","type":"tab","label":"Flow 5","disabled":false,"info":""},{"id":"2731fb1e.8e0be4","type":"ui_chart","z":"83e0e297.8b857","name":"","group":"c9f9e81c.2d0c68","order":11,"width":0,"height":0,"label":"{{msg.payload}}","chartType":"line","legend":"false","xformat":"HH:mm:ss","interpolate":"linear","nodata":"","dot":false,"ymin":"0","ymax":"100","removeOlder":1,"removeOlderPoints":"","removeOlderUnit":"3600","cutout":0,"useOneColor":false,"useUTC":false,"colors":["#1f77b4","#aec7e8","#ff7f0e","#2ca02c","#98df8a","#d62728","#ff9896","#9467bd","#c5b0d5"],"outputs":1,"useDifferentColor":false,"x":790,"y":220,"wires":[]},{"id":"7484a3a1.374bec","type":"MSSQL","z":"83e0e297.8b857","mssqlCN":"df8c0b88.91b0a8","name":"MSSQL","outField":"payload","returnType":"0","throwErrors":"0","query":"SELECT TOP (10) [Temp Uscita PS3] FROM [Cosma].[dbo].[PS3]","modeOpt":"","modeOptType":"query","queryOpt":"","queryOptType":"editor","paramsOpt":"queryParams","paramsOptType":"msg","rows":"","rowsType":"msg","params":,"x":360,"y":180,"wires":[["d4c0ab74.1f7518"]]},{"id":"dbbd0d10.353bc","type":"inject","z":"83e0e297.8b857","name":"","props":[{"p":"payload"},{"p":"topic","vt":"str"}],"repeat":"","crontab":"","once":false,"onceDelay":0.1,"topic":"","payload":"","payloadType":"date","x":160,"y":160,"wires":[["7484a3a1.374bec"]]},{"id":"b6878a33.c65ec8","type":"debug","z":"83e0e297.8b857","name":"","active":true,"tosidebar":true,"console":false,"tostatus":false,"complete":"false","statusVal":"","statusType":"auto","x":760,"y":320,"wires":},{"id":"d4c0ab74.1f7518","type":"function","z":"83e0e297.8b857","name":"","func":"\nreturn msg;","outputs":1,"noerr":0,"initialize":"","finalize":"","libs":,"x":590,"y":260,"wires":[["2731fb1e.8e0be4","b6878a33.c65ec8"]]},{"id":"c9f9e81c.2d0c68","type":"ui_group","name":"TEMPERATURA 3","tab":"a23bd912.769008","order":4,"disp":true,"width":13,"collapse":false},{"id":"df8c0b88.91b0a8","type":"MSSQL-CN","name":"prova_connessione","server":"JOLLY-PC","port":"","encyption":false,"trustServerCertificate":false,"database":"Cosma","useUTC":false,"connectTimeout":"","requestTimeout":"","cancelTimeout":"","pool":"","parseJSON":false,"enableArithAbort":true},{"id":"a23bd912.769008","type":"ui_tab","name":"Home","icon":"dashboard","disabled":false,"hidden":false}]
this is my project, but i can't format the query to display it on the graph, and i don't understand why
In order to make code more readable and importable it is important to surround your code with three backticks
```
like this
```
You can edit and correct your post by clicking the pencil icon.
See this post for more details - How to share code or flow json
[{"id":"83e0e297.8b857","type":"tab","label":"Flow 5","disabled":false,"info":""},{"id":"2731fb1e.8e0be4","type":"ui_chart","z":"83e0e297.8b857","name":"","group":"c9f9e81c.2d0c68","order":11,"width":0,"height":0,"label":"{{msg.payload}}","chartType":"line","legend":"false","xformat":"HH:mm:ss","interpolate":"linear","nodata":"","dot":false,"ymin":"0","ymax":"100","removeOlder":1,"removeOlderPoints":"","removeOlderUnit":"3600","cutout":0,"useOneColor":false,"useUTC":false,"colors":["#1f77b4","#aec7e8","#ff7f0e","#2ca02c","#98df8a","#d62728","#ff9896","#9467bd","#c5b0d5"],"outputs":1,"useDifferentColor":false,"x":790,"y":220,"wires":[[]]},{"id":"7484a3a1.374bec","type":"MSSQL","z":"83e0e297.8b857","mssqlCN":"df8c0b88.91b0a8","name":"MSSQL","outField":"payload","returnType":"0","throwErrors":"0","query":"SELECT TOP (10) [Temp Uscita PS3] FROM [Cosma].[dbo].[PS3]","modeOpt":"","modeOptType":"query","queryOpt":"","queryOptType":"editor","paramsOpt":"queryParams","paramsOptType":"msg","rows":"","rowsType":"msg","params":[],"x":360,"y":180,"wires":[["d4c0ab74.1f7518"]]},{"id":"dbbd0d10.353bc","type":"inject","z":"83e0e297.8b857","name":"","props":[{"p":"payload"},{"p":"topic","vt":"str"}],"repeat":"","crontab":"","once":false,"onceDelay":0.1,"topic":"","payload":"","payloadType":"date","x":160,"y":160,"wires":[["7484a3a1.374bec"]]},{"id":"b6878a33.c65ec8","type":"debug","z":"83e0e297.8b857","name":"","active":true,"tosidebar":true,"console":false,"tostatus":false,"complete":"false","statusVal":"","statusType":"auto","x":760,"y":320,"wires":[]},{"id":"d4c0ab74.1f7518","type":"function","z":"83e0e297.8b857","name":"","func":"\nreturn msg;","outputs":1,"noerr":0,"initialize":"","finalize":"","libs":[],"x":590,"y":260,"wires":[["2731fb1e.8e0be4","b6878a33.c65ec8"]]},{"id":"c9f9e81c.2d0c68","type":"ui_group","name":"TEMPERATURA 3","tab":"a23bd912.769008","order":4,"disp":true,"width":13,"collapse":false},{"id":"df8c0b88.91b0a8","type":"MSSQL-CN","name":"prova_connessione","server":"JOLLY-PC","port":"","encyption":false,"trustServerCertificate":false,"database":"Cosma","useUTC":false,"connectTimeout":"","requestTimeout":"","cancelTimeout":"","pool":"","parseJSON":false,"enableArithAbort":true},{"id":"a23bd912.769008","type":"ui_tab","name":"Home","icon":"dashboard","disabled":false,"hidden":false}]
Have you already watched the videos and read the link I posted on formatting the data? Also there’s a great page in the docs that will explain how to use the debug panel to find the right path to any data item.
Pay particular attention to the part about the buttons that appear under your mouse pointer when you over hover a debug message property in the sidebar.

I have looked at your flow. The first thing you need to do is to add a debug node showing what is coming out of the sql node so you can see what is there.
doc1.pdf (182.3 KB)
You can paste a screenshot here directly. It seems that all you have in your database is a set of values. Are those a sequence over time? If so then you need a timestamp too. If not a sequence over time what values do you want in the x axis?
i want in the x axis, the value contained within the field, Temp Uscita PS3: "10.5"....
Thank you for your kindness.
What do you want in the y axis then?
a range that goes from 0 to 100
Can you show us a few more values in the array (I note there are only 10 of them) and a sketch of what you want the chart to look like?
It may seem simple to you, but it is not easy for me to understand exactly what you want. You said you wanted the values you show to be on the x axis (across the way), what value of y (up the way) do you want against 10.5 and what value against 10.7 and so on. The best thing to do would be to put the values you want into a spreadsheet, create a chart then and then post a screenshot of the chart. Then we should understand.


