Influxdb showing arbitrary timestamps

Hi folks,

I've been programming a simple flow for regularly storing temperature forecasts to Influxdb. The flow is basically as follows: 1. Get the forecast temperature for the next 24+ hours with an hourly timestamp from a REST API, 2. Format the points so that they can be fed to Influxdb 3. Write to Influxdb with a precision of a millisecond. This part works OK.

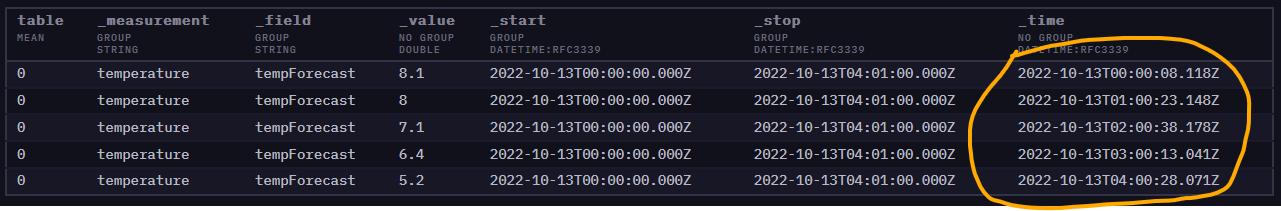
Now, the problem is that when I look at the stored values from Influxdb dashboard, the timestamp (_time field in influxdb) is not on the hour, it's something past. When I first started experimenting with this, all timestamps were 10 minutes past the hour. When I tested it further, at some point all written timestamps were 2 minutes 50 seconds past the hour. And now, it seems to have more of an arbitrary timestamp, a few minutes and seconds past the hour.

What could be the cause of this and is there any way to fix it? Is it a problem with Influxdb dashboard itself?

I'm running Node-Red v. 3.0.2 and Influxdb 2.4.0, both on their own servers.

Here's a sample flow for demo purposes. I have excluded the REST API stuff, and added a few example values/timestamps available in simple tables in the same format they arrive from the REST API.

[{"id":"86657d4a52a58e19","type":"inject","z":"07cd862b6e42e2a6","name":"Start","props":[{"p":"payload"},{"p":"topic","vt":"str"}],"repeat":"","crontab":"","once":false,"onceDelay":0.1,"topic":"","payload":"","payloadType":"date","x":170,"y":680,"wires":[["f1ba83fec0487321"]]},{"id":"f1ba83fec0487321","type":"function","z":"07cd862b6e42e2a6","name":"Build Influxdb data structure","func":"var payloadArray = [];\n\n// Set hourly timestamps\nvar timeISO = [\n    \"2022-10-12T13:00:00Z\",\n    \"2022-10-12T14:00:00Z\",\n    \"2022-10-12T15:00:00Z\",\n    \"2022-10-12T16:00:00Z\",\n    \"2022-10-12T17:00:00Z\",\n    ];\n\n// Set temperatures\nvar temperatures = [\n    \"8.87\",\n    \"9.12\",\n    \"9.2\",\n    \"9.86\",\n    \"10.16\"\n    ]\n\n\nfor ( var i = 0; i < 5; i++ )\n{\n// Set UNIX timestamp in milliseconds\n    var timeUNIX = new Date( timeISO[ i ] ).getTime();\n\n// Change temperature to float with one decimal \n    var forecastTemperature = Number( temperatures[ i ]);\n    forecastTemperature = Math.round( forecastTemperature * 10 ) / 10;\n\n// Construct one influxdb point\n    var pointArray = [\n        {   \n            \"time\": timeUNIX,\n            \"tempForecast\": forecastTemperature\n        }\n    ];\n    \n    payloadArray.push( pointArray );\n}\n\nmsg.payload = payloadArray;\nreturn msg;","outputs":1,"noerr":0,"initialize":"","finalize":"","libs":[],"x":420,"y":680,"wires":[["66d46c36639a1018","c58d644ae3528f82"]]},{"id":"66d46c36639a1018","type":"debug","z":"07cd862b6e42e2a6","name":"Debug payload","active":true,"tosidebar":true,"console":false,"tostatus":false,"complete":"payload","targetType":"msg","statusVal":"","statusType":"auto","x":700,"y":720,"wires":[]},{"id":"c58d644ae3528f82","type":"influxdb out","z":"07cd862b6e42e2a6","influxdb":"42cad80c275bcd67","name":"Write to Influxdb","measurement":"temperature","precision":"","retentionPolicy":"","database":"database","precisionV18FluxV20":"ms","retentionPolicyV18Flux":"","org":"Koti","bucket":"Weather","x":700,"y":640,"wires":[]},{"id":"42cad80c275bcd67","type":"influxdb","hostname":"influxdbsrv","port":"8086","protocol":"http","database":"database","name":"Influxdb server","usetls":false,"tls":"","influxdbVersion":"2.0","url":"http://influxdbsrv:8086","rejectUnauthorized":true,"credentials":{}}]

A Screenshot from Influxdb dashboard showing the funny timestamps after flow execution:

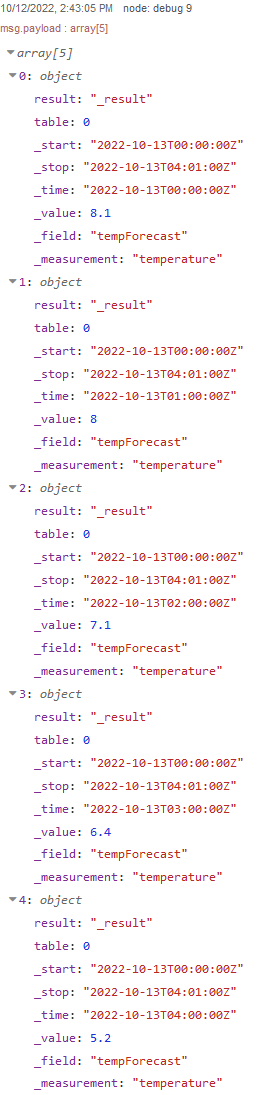
What if the values are queried?

If I make a query from a influxdb In node, say the following:

from( bucket: "Weather" )
    |> range( start: 2022-10-12T13:01:00Z, stop: 2022-10-12T17:01:00Z)

According to the timestamps shown in Influxdb dashboard, it should return the first four values. But instead, it returns the last four, which is basically right from the use case perspective (hours 14, 15, 16 and 17 included), but doesn't work well from the development perspective, if I want to check a graph or the values from Influxdb dashboard.

What are the timestamps in the records it returns? Feed it into a debug node and see what it shows.
If you do the same query in the influx dashboard what do you get?

Also, can you capture an actual set of data being sent to influx (in a debug node) show us what is there and what you see in the influx dashboard for some of those records.

My guess: It seems to be some kind of an Influxdb problem. Here are the test results:

With the forecasted temperature values, I'm inserting these timestamps:

var timeISO = [
    "2022-10-13T00:00:00Z",
    "2022-10-13T01:00:00Z",
    "2022-10-13T02:00:00Z",
    "2022-10-13T03:00:00Z",
    "2022-10-13T04:00:00Z",
    ];

They show in the debug node like this:

When I look at the data in Influxdb dashboard (make a query there), the timestamps seem to be wrong as follows:

Query from Node-red (Influx in node) shows the data like this:

... which is correct.

But then it gets interesting: if I make another query from Influxdb dashboard and fiddle with the time range, the timestamp value changes:

If I change the time range as follows:

... the result is correct compared to the original data, but the timestaps change again!

I'm not seeing this as a correct behaviour, at least on the Influxdb side.

The data in the debug doesn't match that in the db at all. It should be writing the field tempForecast with values like 8, and there aren't any values for the fields start and stop.

Are you sure you are looking at the right database?

I’m quite sure that I’m looking at the right db, I only have one. And this is what I’ve done with it:

  1. Deleted all buckets from influxdb
  2. With a completely bucketless Influxdb, create an empty bucket called WeatherTest
  3. Send tempForecast values to WeatherTest bucket
  4. Query from WeatherTest bucket using both Node-red influxdb in node and Influxdb dashboard

I’ve also wondered the _start and _stop values and what is their purpose. Is there a part of a Node-Red message object (other than msg.payload) that gets inserted when using the influxdb out node?

Not that I know of, but I do notice that you have not formatted the payload correctly for the influx node according to the help text. The node's page on the flows site has a specific example showing how to format it when you wish to write multiple records - see the section starting ' Finally, if msg.payload is an array of arrays'. It would be worth correcting that first. If you haven't got any tags then pass an empty object. It may not make any difference.

I have just looked back at your previous post. Is the conclusion that when you read the data in node-red it is correct, but it is wrong when you read in the dashboard? If so then is it just a dashboard problem and the data is actually correct?

The _start and _stop values in InfluxDB are set by your query or when using the InfluxDB Web-If by the time range you select, e.g. in Explore.

What is strange is your _time column. This one should reflect the timestamp of your value creation. Are you sure that you actually pass the TS correctly? It should look like

msg.payload = [
    {
        measurement: "WeatherTest",
        fields: {
            "tempForecast": 5.5
        },
        timestamp: new Date("2022-10-13T00:00:00")
    }
]

If you do not pass a valid time, InfluxDB will set the TS according to the server time when it has processed the query (check your server time / ntp enabled?)

Well that explains those then. I haven't used Influxdb v2 so I was not aware of that.

When queried using an Influx In node the timestamps appear to be correct. It seems to be only in the dashboard that they are wrong.

@Pera is feeding the timestamps in as millisecond values, with the resolution set to msec in the influx node, so that should be ok.

@Sineos Your example code is correct for an influxdb Batch node, however I'm using Influxdb Out node here, which does not require defining measurement and timestamp separately.

@Sineos Checked my server's date and ntpd, datetime is accurate and ntpd is running.

@Colin In my example, the payload was indeed an array of arrays, but you were right that I didn't use the tag object in the array at all. I tested it now sending also an empty tag object:

// Construct one influxdb point
    var pointArray = [
        {   
            "time": timeUNIX,
            "tempForecast": forecastTemperature
        },
        {
        }
    ];
    
    payloadArray.push( pointArray );

and finally, when all points were formatted correctly:

msg.payload = payloadArray;

As you suspected, there was no change in the jumpy behaviour of timestamps in the Influxdb dashboard (timestamps change every time I modify the time range in the query), and Node-red queries still give the right results.

My Conclusion: Influxdb's own Data Explorer has problems with the timestamp representation. I should probably seek help from an Influxdb forum, most likely here: https://community.influxdata.com/. It's not a huge issue, if the queries will work also from other tools like Grafana, but that is yet to be experimented. Makes it somewhat more awkward to test things, though.

Thank You for the help and support!

I haven't come across this dashboard, exactly what is it and how would I get hold of it?

After installing Influxdb v2, point your browser to localhost:8086 and setup the initial user, or, if you already have done that, login with your credentials. Then you can access various settings of Influxdb and also the Data Explorer, which I referred to as "Dashboard".

"Dashboard" being a bit misleading perhaps, because I noticed that there's also a separate menu/section called "Dashboards" in the Influxdb site.

It seems very odd that that is misbehaving. I can't find any similar issues using Google.

This topic was automatically closed 60 days after the last reply. New replies are no longer allowed.