I would like to present on a dashboard the mac adress of the network adapter in use (wifi or network cable) on the Raspberry Pi 4
First question is, do you know how to get that information from the command line in Raspbian?
If you do then take a look at the "Exec" node, as it can emulate the command line. Next, you may need to sanitise the output so you can use a "Function" node to do that. Then send the output to a dashboard text node.
I can list this information through the ifconfig command through LXteminal, but my question is how to filter on Function only the mac adress .. thanks for the help
Below is the code I am testing
ifconfig = msg.payload;
wlan0 = ifconfig.indexOf ("wlan0");
start = ifconfig.indexOf ("ether", wlan0) + 7;
addr = ifconfig.substring (start, ifconfig.indexOf ('', start));
return {payload: addr};
The other option in this case for the Function node (which makes things easier to visualise) is to use something like node-red-contrib-string. It has many options making extraction very easy.
ok, i found and installed the node-red-contrib-string through the manager pallet menu as your guidance .. can you tell me if you are going to present a new node in the list? that I can use for this situation?
thanks again for your attention
Sorry, not sure I understand your meaning here. Do you mean, should there be a new node in your palette after installation? The answer is yes. Restart NR and refresh your browser. It should be there.

It should be in the Function section, coloured grey, called string.
Why do you need the value to be dynamic? It is a fixed value/number.
In a terminal of the RasPi, enter ifconfig and get the MAC address.
Then you enter that in a text node, or what ever it is you are going to use to display it.
What you are doing is not impossible, but I fail to see why you are making it complicated.
At the top of the list of nodes you have there is a search box.
Enter string in there and you will see the string node.
This is a link on how to get your MAC address and what it looks like.
As there are three ways of doing it, the first is the easiest.
I pulled this out of one of my projects.
You will need node-red-contrib-string

[{"id":"ac5f3bc2.7af238","type":"string","z":"5d144921.4c8e28","name":"WiFi_MAC","methods":[{"name":"between","params":[{"type":"str","value":"wlan0"},{"type":"str","value":"brd"}]},{"name":"between","params":[{"type":"str","value":"ether "},{"type":"str","value":" "}]}],"prop":"payload","propout":"WiFi_MAC","object":"msg","objectout":"msg","x":490,"y":220,"wires":[["2a97d89b.a82a6"]]},{"id":"2a97d89b.a82a6","type":"string","z":"5d144921.4c8e28","name":"Ethernet_MAC","methods":[{"name":"between","params":[{"type":"str","value":"eth0"},{"type":"str","value":"brd"}]},{"name":"between","params":[{"type":"str","value":"ether "},{"type":"str","value":" "}]}],"prop":"payload","propout":"Ethernet_MAC","object":"msg","objectout":"msg","x":660,"y":220,"wires":[["c55f98b7.d57e28"]]},{"id":"dd05af2c.827798","type":"exec","z":"5d144921.4c8e28","command":"ip link show","addpay":false,"append":"","useSpawn":"false","timer":"","oldrc":false,"name":"MAC address","x":300,"y":220,"wires":[["ac5f3bc2.7af238"],[],[]]},{"id":"a2372238.3b939","type":"inject","z":"5d144921.4c8e28","name":"","topic":"","payload":"","payloadType":"date","repeat":"","crontab":"","once":false,"onceDelay":0.1,"x":140,"y":220,"wires":[["dd05af2c.827798"]]},{"id":"2b46f305.e479d4","type":"debug","z":"5d144921.4c8e28","name":"","active":true,"tosidebar":true,"console":false,"tostatus":false,"complete":"true","targetType":"full","x":1010,"y":220,"wires":[]},{"id":"c55f98b7.d57e28","type":"change","z":"5d144921.4c8e28","name":"","rules":[{"t":"delete","p":"payload","pt":"msg"}],"action":"","property":"","from":"","to":"","reg":false,"x":850,"y":220,"wires":[["2b46f305.e479d4"]]}]
Ok, I found the new node string, answering your question I don't need anything very complex ... just that I list in my dashbord the mac address of the network adapter being used, which may be the wired card or wifi card, about the link you sent me would like to use the easiest option that would be the first
follow the image for illustration I made the change as directed .. this is presenting a number for the mac address but not the one corresponding to the card used at the moment .. analyzing through the node-red console I found that this number is the error cod


@ezequiel_barros Don't leave us hanging if you get it working post a screen shot 
also don't stop there you can do some real cool stuff with the dashboard and a Raspberry PI

@meeki007
thank you so much for your help ... the information you posted now would help me a lot on my raspberry monitoring panel too 
For a monitoring panel I use RPI-Monitor as it has a JSON output section.
so you can do things like this.

Here is just the CPU load section so you can start somewhere.... the rest is up to you.
[{"id":"6e9cdd8e.c16c2c","type":"http request","z":"5d144921.4c8e28","name":"","method":"GET","ret":"obj","paytoqs":false,"url":"http://127.0.0.1:8888/dynamic.json","tls":"","persist":false,"proxy":"","authType":"","x":610,"y":380,"wires":[["7e214f58.385e8"]]},{"id":"246d5f06.0e518","type":"ui_gauge","z":"5d144921.4c8e28","name":"","group":"df127116.d46ea","order":2,"width":3,"height":3,"gtype":"gage","title":"CPU Load","label":"","format":"{{value | number:2}}%","min":0,"max":"100","colors":["#00b500","#e6e600","#ca3838"],"seg1":"50","seg2":"75","x":730,"y":420,"wires":[]},{"id":"7e214f58.385e8","type":"function","z":"5d144921.4c8e28","name":"","func":"\n// CPU Load into Percentage\nmsg.CPU_Load_percentage = (msg.payload.load1 / 4) * 100;\n\n\nreturn msg;","outputs":1,"noerr":0,"x":750,"y":380,"wires":[["fec91f99.b2dc38"]]},{"id":"cda96494.3e1828","type":"change","z":"5d144921.4c8e28","name":"","rules":[{"t":"move","p":"payload","pt":"msg","to":"payload2","tot":"msg"}],"action":"","property":"","from":"","to":"","reg":false,"x":430,"y":380,"wires":[["6e9cdd8e.c16c2c"]]},{"id":"fec91f99.b2dc38","type":"change","z":"5d144921.4c8e28","name":"","rules":[{"t":"move","p":"CPU_Load_percentage","pt":"msg","to":"payload","tot":"msg"}],"action":"","property":"","from":"","to":"","reg":false,"x":400,"y":420,"wires":[["246d5f06.0e518"]]},{"id":"e99c3ca8.262b18","type":"http request","z":"5d144921.4c8e28","name":"","method":"GET","ret":"obj","paytoqs":false,"url":"http://127.0.0.1:8888/static.json","tls":"","persist":false,"proxy":"","authType":"","x":250,"y":380,"wires":[["cda96494.3e1828"]]},{"id":"727b29a7.61c48","type":"inject","z":"5d144921.4c8e28","name":"","topic":"","payload":"","payloadType":"date","repeat":"","crontab":"","once":false,"onceDelay":0.1,"x":100,"y":380,"wires":[["e99c3ca8.262b18"]]},{"id":"df127116.d46ea","type":"ui_group","z":"","name":"System_Status","tab":"9587580.e6ae3a8","order":1,"disp":false,"width":8,"collapse":false},{"id":"9587580.e6ae3a8","type":"ui_tab","z":"","name":"System","icon":"dashboard","order":4,"disabled":false,"hidden":false}]
Link to RPI-monitor
https://xavierberger.github.io/RPi-Monitor-docs/11_installation.html
Its nice to see I am not the only data nut out here.
This is my pride - well, one of them.
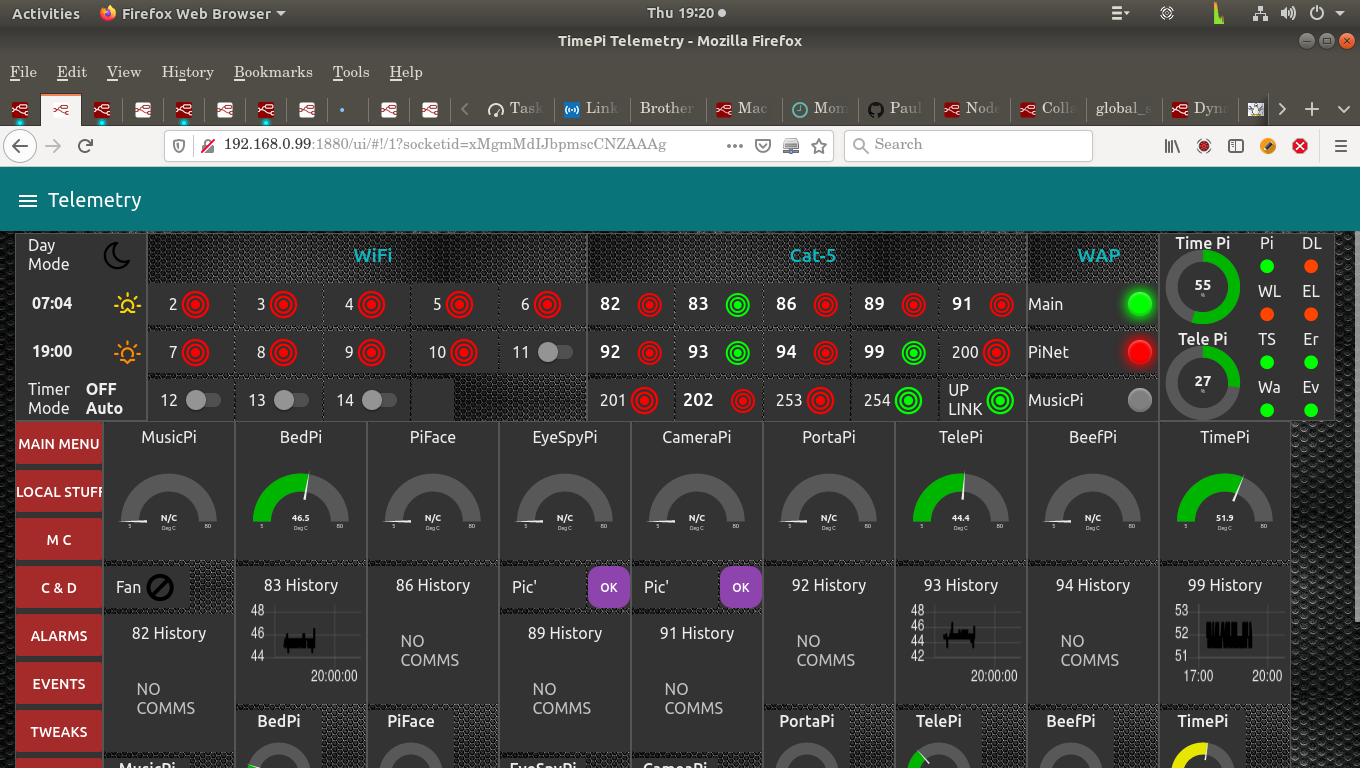
That is the main machine and this is what the remote ones have:

I could show you more, but I think that is just showing off.
I have been messing around a few years with Node-Red.
The big one shows the device states, WAP states and the two main machine's CPU load.
Then you have the row of temperatures and history. And at the bottom - just visible - are all the CPU loads for the machines.
The second one shows you the temperature and CPU load, the state of a couple of important links. A list of events for the uplink and the error control panel.
I have a whole screen for machine health. (Sorry, starting to brag too much.)
SORRY!
I didn't read the bit at the bottom.
I still haven't been able to present the mac address of my raspberry. can someone post json in a very simple way
thank you for your help so far
in an exec node use eithor
cat /sys/class/net/eth0/address
cat /sys/class/net/lo/address or
cat /sys/class/net/wlan0/address
depending on which one you want.