Multiline Chart with JSONata

Hello @Andrei,

Could you indulge for one+ iteration yet again? I need to display (retrieved in the sense that I have control over the rows and columns) data in a multi-line chart. I have read some of the discussions and you were kind enough to assist me with tabulating similar data with Angular expressions. In the current situation, it is my understanding that JSONata can do the trick but after several attempts I feel that the expertise needed to solve the problem is significantly above my pay grade.

The data is as follows:

[
  [
    {
      "RID": 1,
      "Waqt": "2020-03-09T17:56:18.000Z",
      "DeviceId": 1461,
      "Status": "0",
      "Reading": 100,
      "Dimension": "Temperature",
      "UOM": "°C"
    },
    {
      "RID": 2,
      "Waqt": "2020-03-09T22:57:00.000Z",
      "DeviceId": 1453,
      "Status": "2",
      "Reading": 34.43,
      "Dimension": "Temperature",
      "UOM": "°C"
    },
    {
      "RID": 5,
      "Waqt": "2020-03-09T17:57:18.000Z",
      "DeviceId": 1461,
      "Status": "0",
      "Reading": 100,
      "Dimension": "Temperature",
      "UOM": "°C"
    },
    {
      "RID": 6,
      "Waqt": "2020-03-09T22:58:00.000Z",
      "DeviceId": 1453,
      "Status": "2",
      "Reading": 34.5,
      "Dimension": "Temperature",
      "UOM": "°C"
    },
    {
      "RID": 9,
      "Waqt": "2020-03-09T17:58:18.000Z",
      "DeviceId": 1461,
      "Status": "0",
      "Reading": 100,
      "Dimension": "Temperature",
      "UOM": "°C"
    },
    {
      "RID": 10,
      "Waqt": "2020-03-09T22:59:01.000Z",
      "DeviceId": 1453,
      "Status": "2",
      "Reading": 34.37,
      "Dimension": "Temperature",
      "UOM": "°C"
    },
    {
      "RID": 13,
      "Waqt": "2020-03-09T17:59:18.000Z",
      "DeviceId": 1461,
      "Status": "0",
      "Reading": 100,
      "Dimension": "Temperature",
      "UOM": "°C"
    },
    {
      "RID": 14,
      "Waqt": "2020-03-09T23:00:01.000Z",
      "DeviceId": 1453,
      "Status": "2",
      "Reading": 34.5,
      "Dimension": "Temperature",
      "UOM": "°C"
    },
    {
      "RID": 17,
      "Waqt": "2020-03-09T18:00:18.000Z",
      "DeviceId": 1461,
      "Status": "0",
      "Reading": 100,
      "Dimension": "Temperature",
      "UOM": "°C"
    },
    {
      "RID": 18,
      "Waqt": "2020-03-09T23:01:01.000Z",
      "DeviceId": 1453,
      "Status": "2",
      "Reading": 34.43,
      "Dimension": "Temperature",
      "UOM": "°C"
    },
    {
      "RID": 21,
      "Waqt": "2020-03-09T18:01:17.000Z",
      "DeviceId": 1461,
      "Status": "0",
      "Reading": 100,
      "Dimension": "Temperature",
      "UOM": "°C"
    },
    {
      "RID": 22,
      "Waqt": "2020-03-09T23:02:01.000Z",
      "DeviceId": 1453,
      "Status": "2",
      "Reading": 34.35,
      "Dimension": "Temperature",
      "UOM": "°C"
    },
    {
      "RID": 25,
      "Waqt": "2020-03-09T18:02:17.000Z",
      "DeviceId": 1461,
      "Status": "0",
      "Reading": 100,
      "Dimension": "Temperature",
      "UOM": "°C"
    },
    {
      "RID": 26,
      "Waqt": "2020-03-09T23:03:02.000Z",
      "DeviceId": 1453,
      "Status": "2",
      "Reading": 34.41,
      "Dimension": "Temperature",
      "UOM": "°C"
    },
    {
      "RID": 29,
      "Waqt": "2020-03-09T18:03:17.000Z",
      "DeviceId": 1461,
      "Status": "0",
      "Reading": 100,
      "Dimension": "Temperature",
      "UOM": "°C"
    },
  ],
  {
    "fieldCount": 0,
    "affectedRows": 0,
    "insertId": 0,
    "serverStatus": 34,
    "warningCount": 0,
    "message": "",
    "protocol41": true,
    "changedRows": 0
  }
]

It is my understanding that this data has to be cast "somehow." While I was able to use simple JSONata, I got lost completely in deeper expressions with the JSONata Exerciser. My last attempt was as follows:


(
  $series := [
    { "field": $distinct($.Dimension), "label": $distinct($.DeviceId) }
  ];
  $xaxis := $.Waqt;
  $yaxis := $.field;
    {
      "series": $series.label,
      "data": $series.
        (
          $yaxis := $.Reading;
          $$.payload.{
            "x": $lookup($, $xaxis),
            "y": $lookup($, $yaxis)
          }
        )
    }
)

DeviceId, Waqt & Reading are in the input data stream. I need help in assembling them for multiline chart usage. Of course, the JSONata expression above is completely erroneous but I don't know how to recover. Any advice would be appreciated. You can recommend changes (to input also) as you see fit. Thanks.

Kind regards.

Hi @baqwas, sure. I will have a look and will come back to you sooner.

Edit: not so difficult as I thought in the first place but let´s review together what I got.

Assumption: You want to plot a multi-line chart that gives Temperature (y axis) versus time (x axis).

In such case we have to transform your input dataset to the "typical dataset" formatted as an array of arrays (each internal array is a set of x,y points).

[
  [
    { "x": datetime1, "y":30 },
    { "x": datetime2, "y":20 },
    { "x": datetime3, "y":40 }
  ],
  [
    { "x": datetime1, "y":30 },
    { "x": datetime2, "y":20 },
    { "x": datetime3, "y":40 }
  ]
]

One possible JSONata expression for this use case could be:

payload.$map(
   $distinct([DeviceId]),
   function($v) {
       $[DeviceId=$v].{"x" : Waqt, "y" : Reading} 
   }
)

I will explain the JSONata later on (after you confirm it is producing the expected result).

We can use a kind of boilerplate inside a function node to format the data structure that will be used by the ui_chart node.

let data = msg.payload;
let series = ["A", "B"];
let labels = ["Temp"];

msg.payload = [{"series":series, "data":data,"labels": labels}];

return msg;

Remarks:

1 - It is missing to build a jsonata expression to create the series names though (it is hard coded as A,B for the time being).

2- The sample dataset you provided has a series of points that span a small time frame (6 minutes) and each one is separated by several hours, so the final chart will display each line with a very small size.

This is a testing flow:

[{"id":"38fa9c5a.795a14","type":"tab","label":"Flow 1","disabled":false,"info":""},{"id":"f409bc68.b0c1d","type":"change","z":"38fa9c5a.795a14","name":"","rules":[{"t":"set","p":"payload","pt":"msg","to":"payload.$map($distinct([DeviceId]),function($v) {    $[DeviceId=$v].{\"x\" : Waqt, \"y\" : Reading} })","tot":"jsonata"}],"action":"","property":"","from":"","to":"","reg":false,"x":520,"y":180,"wires":[["58f1c125.9cec7","6eb1c53f.1ed0ac"]]},{"id":"f7841844.e57a18","type":"inject","z":"38fa9c5a.795a14","name":"","topic":"","payload":"[[{\"RID\":1,\"Waqt\":\"2020-03-09T17:56:20.000Z\",\"DeviceId\":1461,\"Status\":\"0\",\"Reading\":100,\"Dimension\":\"Temperature\",\"UOM\":\"°C\"},{\"RID\":2,\"Waqt\":\"2020-03-09T22:57:00.000Z\",\"DeviceId\":1453,\"Status\":\"2\",\"Reading\":34.43,\"Dimension\":\"Temperature\",\"UOM\":\"°C\"},{\"RID\":5,\"Waqt\":\"2020-03-09T17:57:20.000Z\",\"DeviceId\":1461,\"Status\":\"0\",\"Reading\":120,\"Dimension\":\"Temperature\",\"UOM\":\"°C\"},{\"RID\":6,\"Waqt\":\"2020-03-09T22:58:00.000Z\",\"DeviceId\":1453,\"Status\":\"2\",\"Reading\":34.5,\"Dimension\":\"Temperature\",\"UOM\":\"°C\"},{\"RID\":9,\"Waqt\":\"2020-03-09T17:58:20.000Z\",\"DeviceId\":1461,\"Status\":\"0\",\"Reading\":110,\"Dimension\":\"Temperature\",\"UOM\":\"°C\"},{\"RID\":10,\"Waqt\":\"2020-03-09T22:59:01.000Z\",\"DeviceId\":1453,\"Status\":\"2\",\"Reading\":34.37,\"Dimension\":\"Temperature\",\"UOM\":\"°C\"},{\"RID\":13,\"Waqt\":\"2020-03-09T17:59:20.000Z\",\"DeviceId\":1461,\"Status\":\"0\",\"Reading\":130,\"Dimension\":\"Temperature\",\"UOM\":\"°C\"},{\"RID\":14,\"Waqt\":\"2020-03-09T23:00:01.000Z\",\"DeviceId\":1453,\"Status\":\"2\",\"Reading\":34.5,\"Dimension\":\"Temperature\",\"UOM\":\"°C\"},{\"RID\":17,\"Waqt\":\"2020-03-09T18:00:20.000Z\",\"DeviceId\":1461,\"Status\":\"0\",\"Reading\":160,\"Dimension\":\"Temperature\",\"UOM\":\"°C\"},{\"RID\":18,\"Waqt\":\"2020-03-09T23:01:01.000Z\",\"DeviceId\":1453,\"Status\":\"2\",\"Reading\":34.43,\"Dimension\":\"Temperature\",\"UOM\":\"°C\"},{\"RID\":21,\"Waqt\":\"2020-03-09T18:01:20.000Z\",\"DeviceId\":1461,\"Status\":\"0\",\"Reading\":130,\"Dimension\":\"Temperature\",\"UOM\":\"°C\"},{\"RID\":22,\"Waqt\":\"2020-03-09T23:02:01.000Z\",\"DeviceId\":1453,\"Status\":\"2\",\"Reading\":34.35,\"Dimension\":\"Temperature\",\"UOM\":\"°C\"},{\"RID\":25,\"Waqt\":\"2020-03-09T18:02:20.000Z\",\"DeviceId\":1461,\"Status\":\"0\",\"Reading\":100,\"Dimension\":\"Temperature\",\"UOM\":\"°C\"},{\"RID\":26,\"Waqt\":\"2020-03-09T23:03:02.000Z\",\"DeviceId\":1453,\"Status\":\"2\",\"Reading\":34.41,\"Dimension\":\"Temperature\",\"UOM\":\"°C\"},{\"RID\":29,\"Waqt\":\"2020-03-09T18:03:17.000Z\",\"DeviceId\":1461,\"Status\":\"0\",\"Reading\":110,\"Dimension\":\"Temperature\",\"UOM\":\"°C\"}],{\"fieldCount\":0,\"affectedRows\":0,\"insertId\":0,\"serverStatus\":34,\"warningCount\":0,\"message\":\"\",\"protocol41\":true,\"changedRows\":0}]","payloadType":"json","repeat":"","crontab":"","once":false,"onceDelay":0.1,"x":290,"y":180,"wires":[["f409bc68.b0c1d"]]},{"id":"58f1c125.9cec7","type":"debug","z":"38fa9c5a.795a14","name":"","active":false,"tosidebar":true,"console":false,"tostatus":false,"complete":"false","x":710,"y":280,"wires":[]},{"id":"c6f32182.b5f87","type":"ui_chart","z":"38fa9c5a.795a14","name":"","group":"216223c5.ed63cc","order":5,"width":"17","height":"8","label":"","chartType":"line","legend":"true","xformat":"auto","interpolate":"linear","nodata":"","dot":false,"ymin":"","ymax":"","removeOlder":"100","removeOlderPoints":"1000","removeOlderUnit":"604800","cutout":0,"useOneColor":false,"colors":["#ff8040","#008000","#ff8000","#2ca02c","#98df8a","#d62728","#ff9896","#9467bd","#c5b0d5"],"useOldStyle":false,"outputs":1,"x":910,"y":180,"wires":[[]]},{"id":"6eb1c53f.1ed0ac","type":"function","z":"38fa9c5a.795a14","name":"Dataset","func":"let data = msg.payload;\nlet series = [\"A\", \"B\"];\nlet labels = [\"Temp\"];\n\nmsg.payload = [{\"series\":series, \"data\":data,\"labels\": labels}];\n\nreturn msg;\n\n","outputs":1,"noerr":0,"x":740,"y":180,"wires":[["c6f32182.b5f87"]]},{"id":"216223c5.ed63cc","type":"ui_group","z":"","name":"Chart","tab":"7a6b569.78cb5a8","disp":true,"width":"17","collapse":false},{"id":"7a6b569.78cb5a8","type":"ui_tab","z":"","name":"Home","icon":"dashboard","order":7}]

Hello @Andrei,

Sorry for the belated response. Please allow another ten+ days for further work on this topic since I do not have access to the "farm" currently.

I adapted your flow (I think that this reincarnation observes your suggestions):
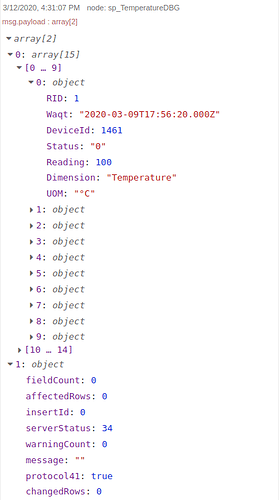
Screenshot from 2020-03-12 16-47-29

[{"id":"6311ade.c7b4a54","type":"function","z":"202ea5e3.ae1b3a","name":"Prep4LineChart","func":"let data = msg.payload;\nlet series = [\"A\", \"B\"];\nlet labels = [\"Temp\"];\n\nmsg.payload = [{\"series\":series, \"data\":data,\"labels\": labels}];\nnode.status({fill: \"yellow\", shape: \"ring\", text: (new Date()).toLocaleTimeString('en-US')});\nreturn msg;","outputs":1,"noerr":0,"x":800,"y":1000,"wires":[["45edc1db.21e31","73b902f2.75837c"]],"info":"[\n [\n {\n \"RID\": 1643212,\n \"Waqt\": \"2020-01-18T06:00:55.000Z\",\n \"DeviceId\": 1453,\n \"Status\": \"0\",\n \"Reading\": 36.74,\n \"Dimension\": \"Temperature\",\n \"UOM\": \"°C\"\n },\n {\n \"RID\": 1643215,\n \"Waqt\": \"2020-01-18T06:07:54.000Z\",\n \"DeviceId\": 1453,\n \"Status\": \"0\",\n \"Reading\": 36.92,\n \"Dimension\": \"Temperature\",\n \"UOM\": \"°C\"\n },\n {\n \"RID\": 1643218,\n \"Waqt\": \"2020-01-18T06:08:54.000Z\",\n \"DeviceId\": 1453,\n \"Status\": \"0\",\n \"Reading\": 36.74,\n \"Dimension\": \"Temperature\",\n \"UOM\": \"°C\"\n },\n {\n \"RID\": 1643221,\n \"Waqt\": \"2020-01-18T06:15:04.000Z\",\n \"DeviceId\": 1453,\n \"Status\": \"0\",\n \"Reading\": 36.72,\n \"Dimension\": \"Temperature\",\n \"UOM\": \"°C\"\n },\n\n[[{\n\"RID\": 1672477,\n\"Waqt\": \"2020-02-09T23:52:35.000Z\",\n\"DeviceId\": 1453,\n\"Status\": \"0\",\n\"Reading\": 25.02,\n\"Dimension\": \"Temperature\",\n\"UOM\": \"°C\"\n},{\n\"RID\": 1672480,\n\"Waqt\": \"2020-02-09T23:53:35.000Z\",\n\"DeviceId\": 1453,\n\"Status\": \"0\",\n\"Reading\": 25.83,\n\"Dimension\": \"Temperature\",\n\"UOM\": \"°C\"\n},{\n\"RID\": 1672483,\n\"Waqt\": \"2020-02-09T23:54:36.000Z\",\n\"DeviceId\": 1453,\n\"Status\": \"0\",\n\"Reading\": 26.64,\n\"Dimension\": \"Temperature\",\n\"UOM\": \"°C\"\n},{\n\"RID\": 1672486,\n\"Waqt\": \"2020-02-09T23:55:36.000Z\",\n\"DeviceId\": 1453,\n\"Status\": \"0\",\n\"Reading\": 27.33,\n\"Dimension\": \"Temperature\", \n\"UOM\": \"°C\"\n}]]\n\n/*\npayload[0][1].DeviceId 1453\npayload[0][1].Reading 34.43\n\n*/\n/*\nvar msgOut = {\n topic: msg.payload[0][1].DeviceId,\n payload: msg.payload[0][1].Reading\n};\nnode.status({fill:\"green\", shape:\"dot\", text:(new Date()).toISOString()});\nreturn msgOut;\n*/\nreturn msg;"},{"id":"45edc1db.21e31","type":"ui_chart","z":"202ea5e3.ae1b3a","name":"SensorTemperatures","group":"3442ea3a.3198fe","order":0,"width":0,"height":0,"label":"{{msg.topic}}","chartType":"line","legend":"false","xformat":"HH:mm:ss","interpolate":"linear","nodata":"","dot":false,"ymin":"","ymax":"","removeOlder":1,"removeOlderPoints":"","removeOlderUnit":"604800","cutout":0,"useOneColor":false,"colors":["#1f77b4","#aec7e8","#ff7f0e","#2ca02c","#98df8a","#d62728","#ff9896","#9467bd","#c5b0d5"],"useOldStyle":false,"outputs":1,"x":1040,"y":1060,"wires":[[]]},{"id":"75dab38b.076734","type":"change","z":"202ea5e3.ae1b3a","name":"Map4LineChart","rules":[{"t":"set","p":"payload","pt":"msg","to":"payload.$map($distinct([DeviceId]),function($v) { $[DeviceId=$v].{\"x\" : Waqt, \"y\" : Reading} })","tot":"jsonata"}],"action":"","property":"","from":"","to":"","reg":false,"x":800,"y":940,"wires":[["6311ade.c7b4a54","c4c9d58e.e8f8b"]]},{"id":"450caa05.059d94","type":"debug","z":"202ea5e3.ae1b3a","name":"sp_TemperatureDBG","active":true,"tosidebar":true,"console":false,"tostatus":false,"complete":"payload","targetType":"msg","x":1040,"y":880,"wires":[]},{"id":"c4c9d58e.e8f8b","type":"debug","z":"202ea5e3.ae1b3a","name":"Map4LineChartDBG","active":true,"tosidebar":true,"console":false,"tostatus":false,"complete":"payload","targetType":"msg","x":1040,"y":940,"wires":[]},{"id":"73b902f2.75837c","type":"debug","z":"202ea5e3.ae1b3a","name":"Prep4LineChartDGB","active":true,"tosidebar":true,"console":false,"tostatus":false,"complete":"payload","targetType":"msg","x":1040,"y":1000,"wires":[]},{"id":"665a29ea.941588","type":"inject","z":"202ea5e3.ae1b3a","name":"","topic":"","payload":"[[{\"RID\":1,\"Waqt\":\"2020-03-09T17:56:20.000Z\",\"DeviceId\":1461,\"Status\":\"0\",\"Reading\":100,\"Dimension\":\"Temperature\",\"UOM\":\"°C\"},{\"RID\":2,\"Waqt\":\"2020-03-09T22:57:00.000Z\",\"DeviceId\":1453,\"Status\":\"2\",\"Reading\":34.43,\"Dimension\":\"Temperature\",\"UOM\":\"°C\"},{\"RID\":5,\"Waqt\":\"2020-03-09T17:57:20.000Z\",\"DeviceId\":1461,\"Status\":\"0\",\"Reading\":120,\"Dimension\":\"Temperature\",\"UOM\":\"°C\"},{\"RID\":6,\"Waqt\":\"2020-03-09T22:58:00.000Z\",\"DeviceId\":1453,\"Status\":\"2\",\"Reading\":34.5,\"Dimension\":\"Temperature\",\"UOM\":\"°C\"},{\"RID\":9,\"Waqt\":\"2020-03-09T17:58:20.000Z\",\"DeviceId\":1461,\"Status\":\"0\",\"Reading\":110,\"Dimension\":\"Temperature\",\"UOM\":\"°C\"},{\"RID\":10,\"Waqt\":\"2020-03-09T22:59:01.000Z\",\"DeviceId\":1453,\"Status\":\"2\",\"Reading\":34.37,\"Dimension\":\"Temperature\",\"UOM\":\"°C\"},{\"RID\":13,\"Waqt\":\"2020-03-09T17:59:20.000Z\",\"DeviceId\":1461,\"Status\":\"0\",\"Reading\":130,\"Dimension\":\"Temperature\",\"UOM\":\"°C\"},{\"RID\":14,\"Waqt\":\"2020-03-09T23:00:01.000Z\",\"DeviceId\":1453,\"Status\":\"2\",\"Reading\":34.5,\"Dimension\":\"Temperature\",\"UOM\":\"°C\"},{\"RID\":17,\"Waqt\":\"2020-03-09T18:00:20.000Z\",\"DeviceId\":1461,\"Status\":\"0\",\"Reading\":160,\"Dimension\":\"Temperature\",\"UOM\":\"°C\"},{\"RID\":18,\"Waqt\":\"2020-03-09T23:01:01.000Z\",\"DeviceId\":1453,\"Status\":\"2\",\"Reading\":34.43,\"Dimension\":\"Temperature\",\"UOM\":\"°C\"},{\"RID\":21,\"Waqt\":\"2020-03-09T18:01:20.000Z\",\"DeviceId\":1461,\"Status\":\"0\",\"Reading\":130,\"Dimension\":\"Temperature\",\"UOM\":\"°C\"},{\"RID\":22,\"Waqt\":\"2020-03-09T23:02:01.000Z\",\"DeviceId\":1453,\"Status\":\"2\",\"Reading\":34.35,\"Dimension\":\"Temperature\",\"UOM\":\"°C\"},{\"RID\":25,\"Waqt\":\"2020-03-09T18:02:20.000Z\",\"DeviceId\":1461,\"Status\":\"0\",\"Reading\":100,\"Dimension\":\"Temperature\",\"UOM\":\"°C\"},{\"RID\":26,\"Waqt\":\"2020-03-09T23:03:02.000Z\",\"DeviceId\":1453,\"Status\":\"2\",\"Reading\":34.41,\"Dimension\":\"Temperature\",\"UOM\":\"°C\"},{\"RID\":29,\"Waqt\":\"2020-03-09T18:03:17.000Z\",\"DeviceId\":1461,\"Status\":\"0\",\"Reading\":110,\"Dimension\":\"Temperature\",\"UOM\":\"°C\"}],{\"fieldCount\":0,\"affectedRows\":0,\"insertId\":0,\"serverStatus\":34,\"warningCount\":0,\"message\":\"\",\"protocol41\":true,\"changedRows\":0}]","payloadType":"json","repeat":"","crontab":"","once":false,"onceDelay":0.1,"x":630,"y":880,"wires":[["75dab38b.076734","450caa05.059d94"]]},{"id":"3442ea3a.3198fe","type":"ui_group","z":"","name":"Telemetry","tab":"8344cf89.4e591","order":4,"disp":true,"width":"6","collapse":true},{"id":"8344cf89.4e591","type":"ui_tab","z":"","name":"RSL10","icon":"dashboard","order":3,"disabled":false,"hidden":false}]

However, the only Debug node that generated output was the Inject node:

Also, understand your comment about static labels - perfectly fine for now. As far as the time data is concerned, I've cut-and-pasted insufficient values but again this is not a true roadblock, I believe, although I will have to solve the "time-series" challenges in the future.

Kind regards.

It is working for me with the latest code you posted.

The code uses jsonata function $distinct that is somehow new (added with jsonata 1.7.0). What is the Node-RED version used in your testing ?

Thx for the confirmation. I have v0.20.7 running. Your feedback leads me to believe that something is wrong in my installation. Let me try on a fresh build (perhaps explore the new RPi imaging tool along the way) and get back to you after next weekend.

Kind regards.

Good, surely it will work on an updated system.

This topic was automatically closed 30 days after the last reply. New replies are no longer allowed.