Hello team!
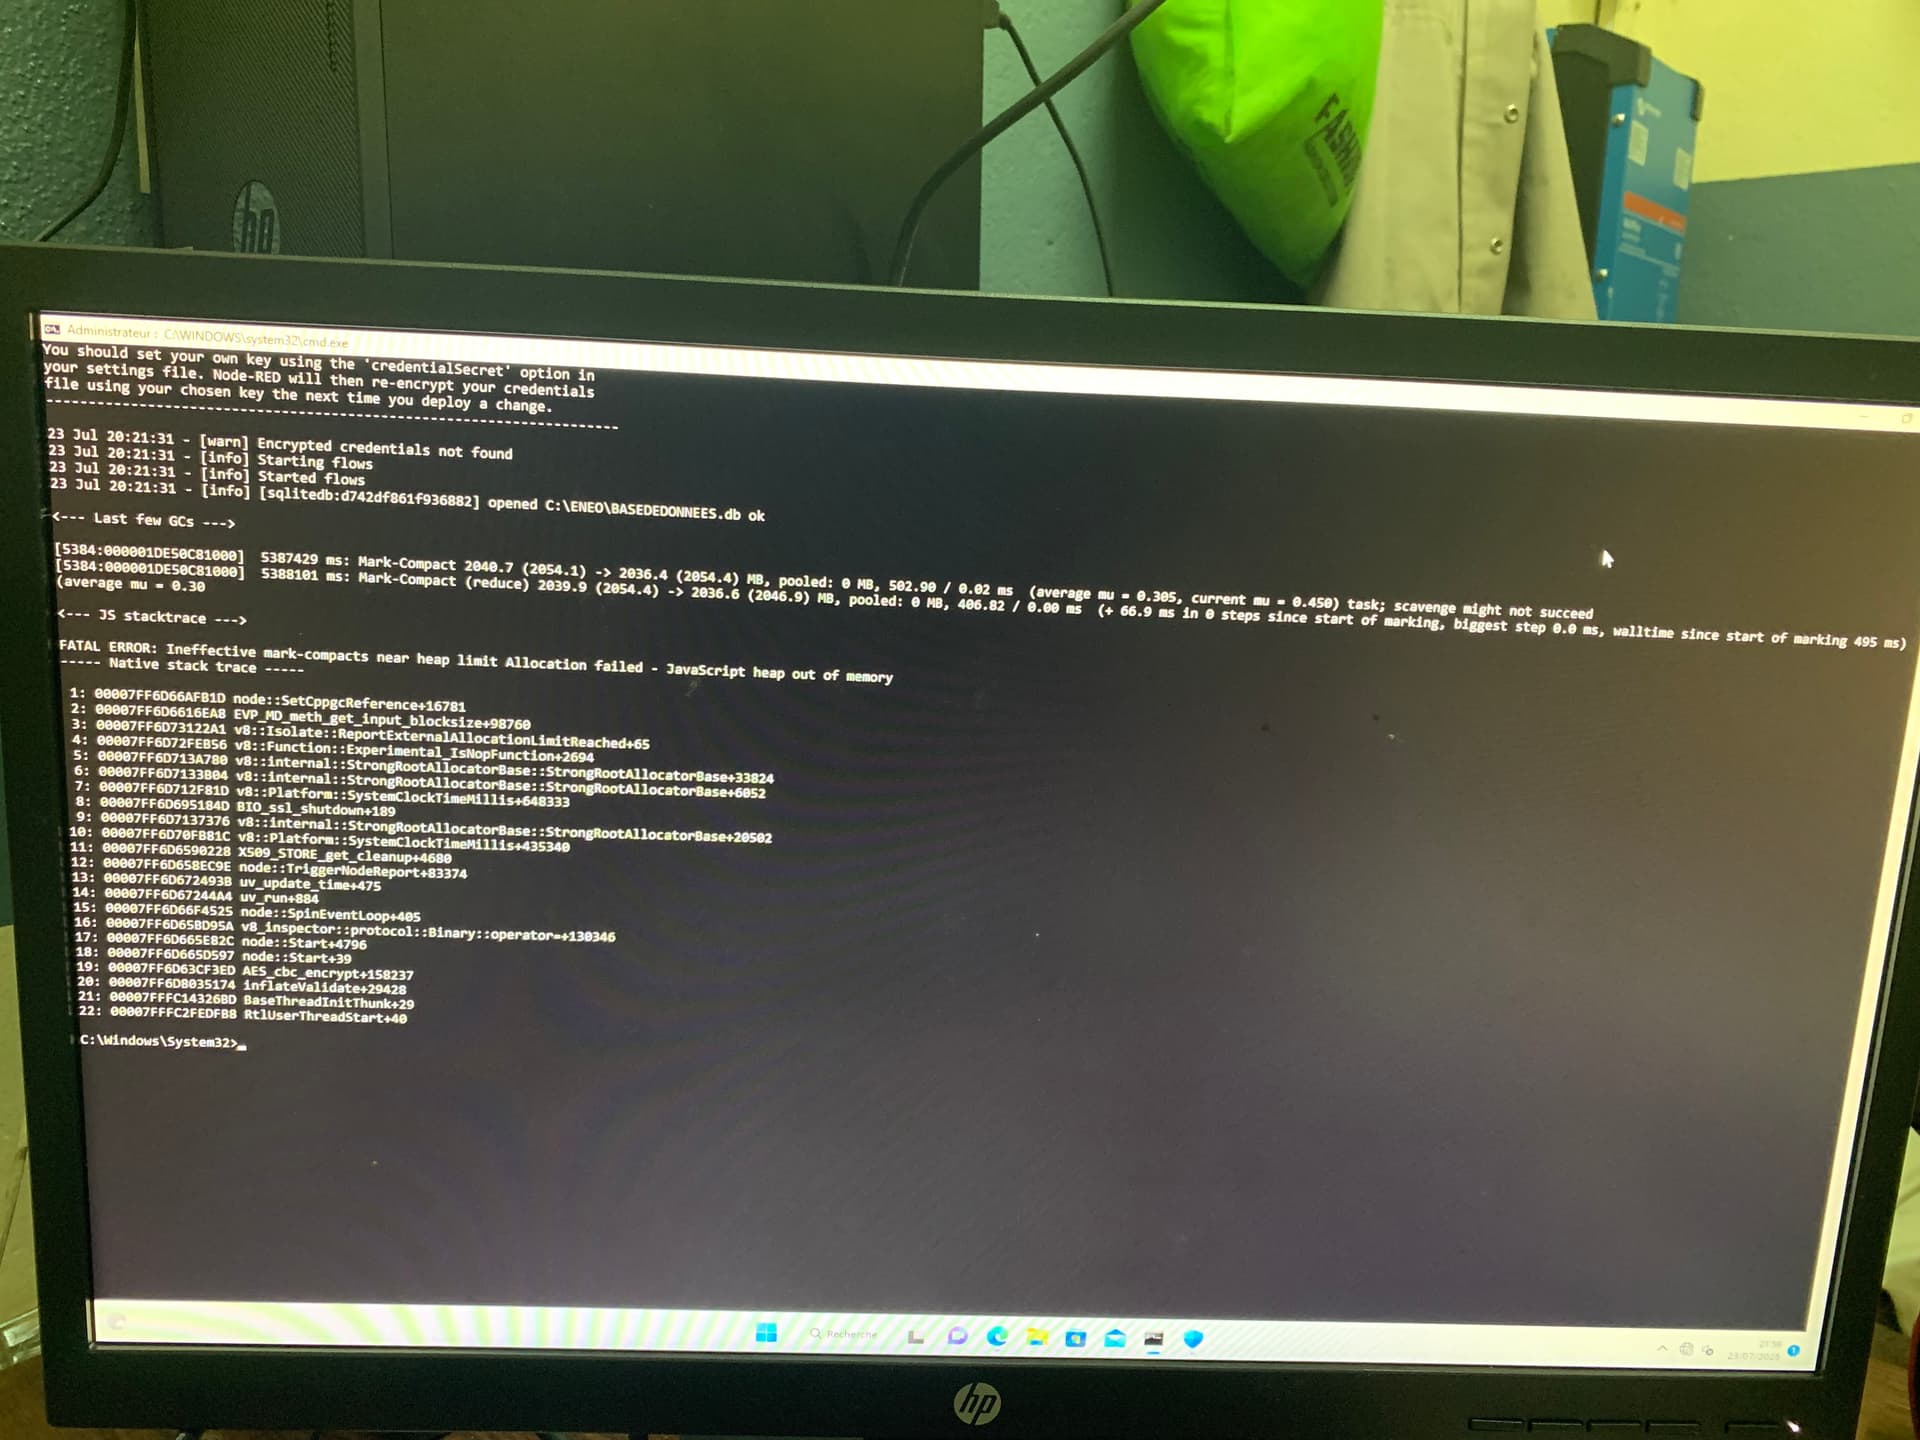
My node red clashes after few hours of use. Here below is an image of the message display anytime it clashes.
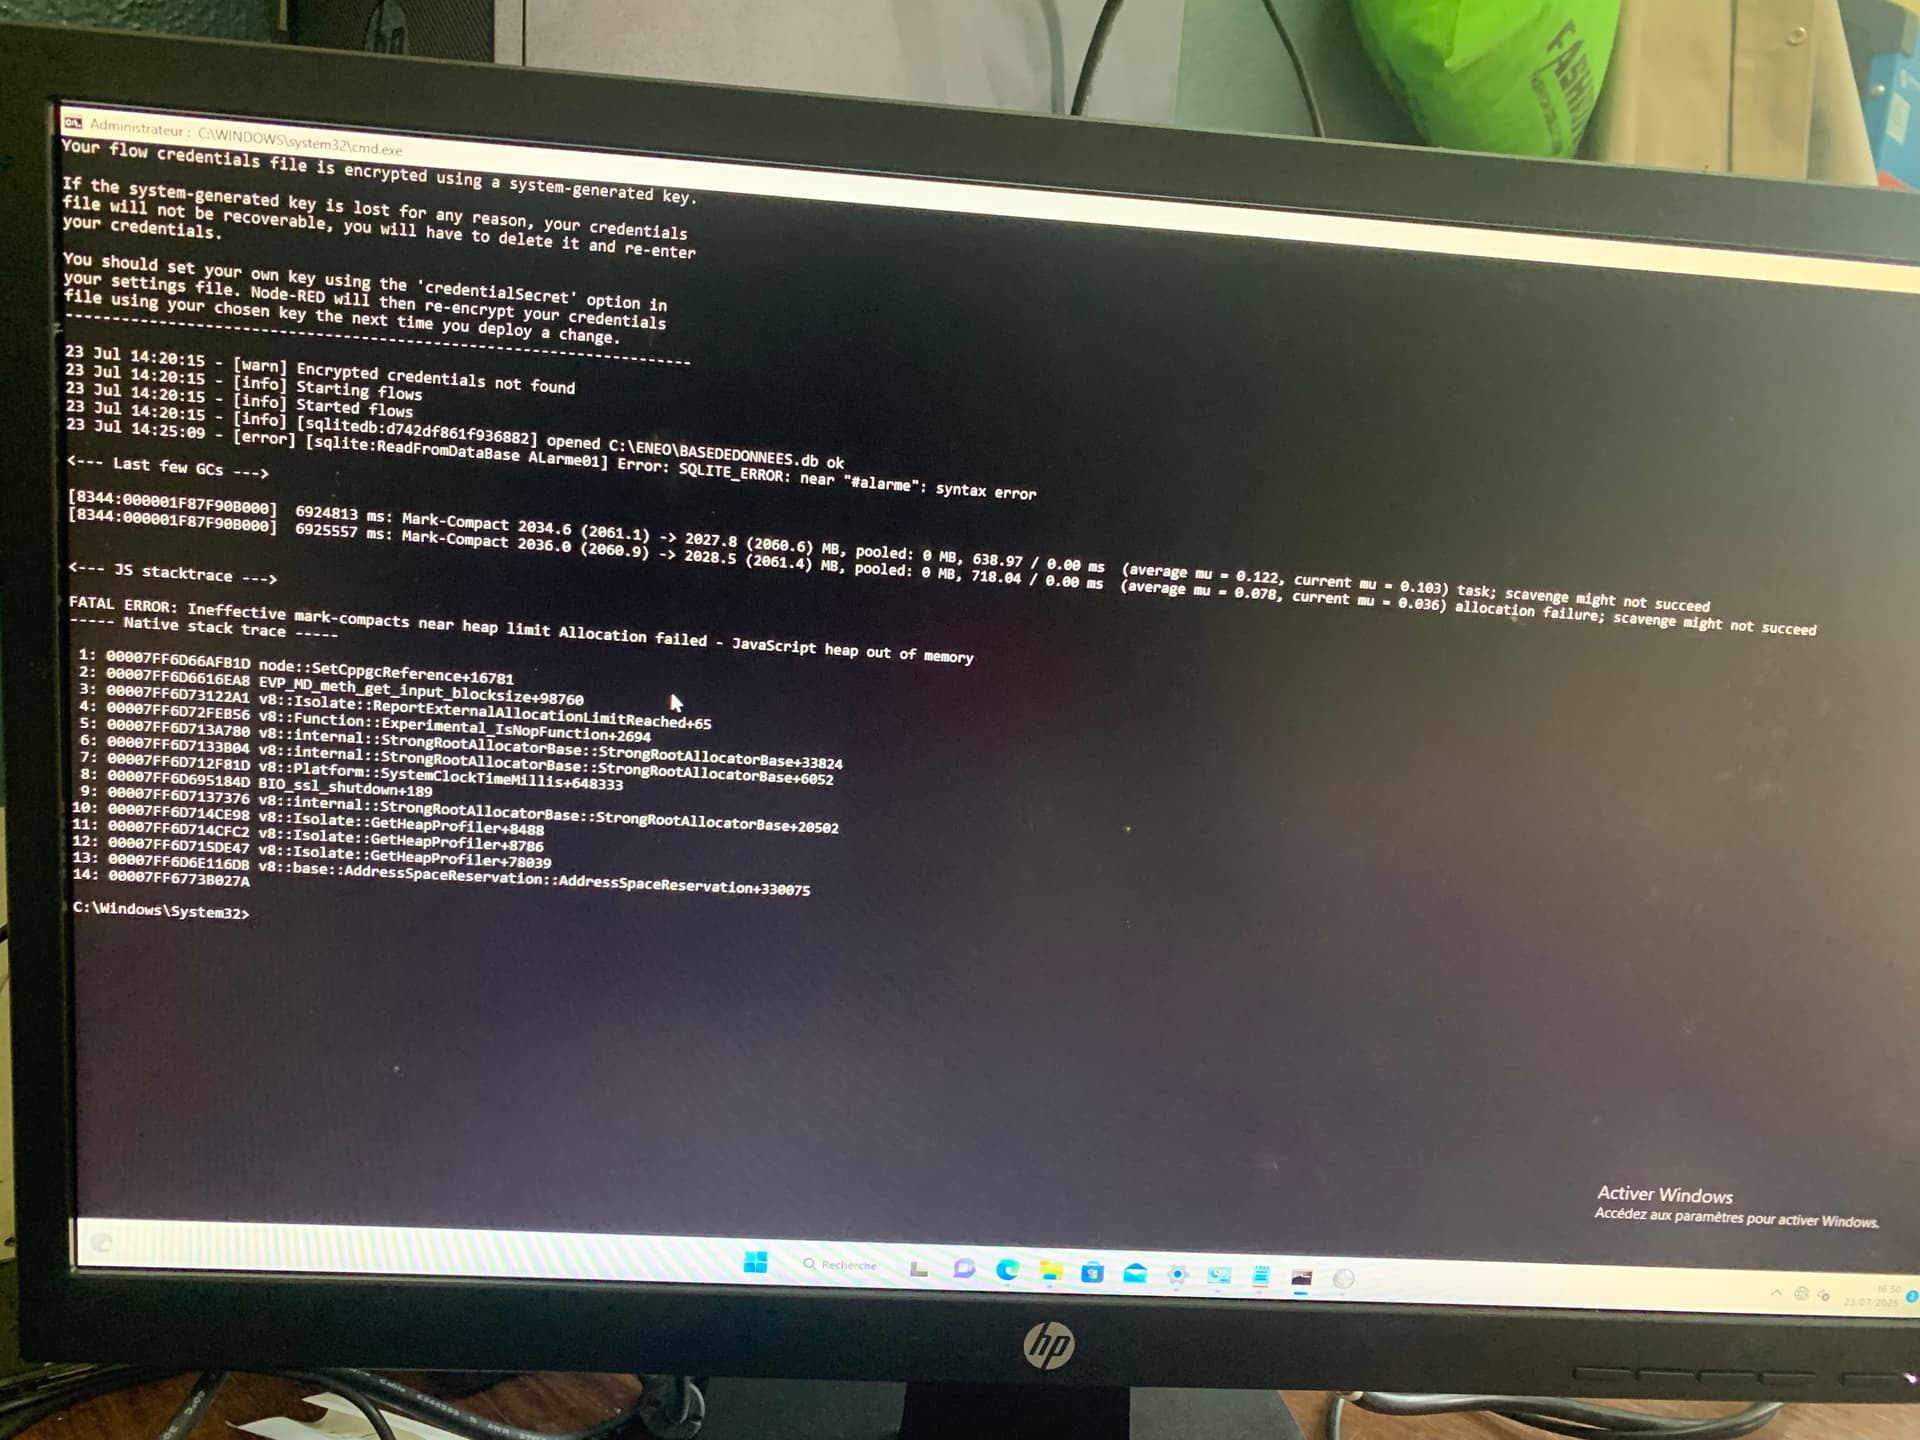
Any idea on what could be the cause of this failure, please….
Thanks in advance
In future, if possible, please copy/paste logs rather than an image.
As it says, you have an error in your sql syntax in the node ReadFromDatabase. Probably the invalid message sent by that node is confusing the flow after it and causing the out of memory error and the crash.
I suggest removing the wire out of the sql node so that it won't attempt to use the output of that node and then work out what is wrong with your sql.
I will remove the node-red-dashboard tag from your message as it is nothing to do with the dashboard.
Did you see my previous comment?
If it is still happening then you have something in your flows that is using up all the memory.
Did this start happening after a change you made? If so then roll back that change to see if it is fixed.
Also can you show us the start of the node-red startup output please.
What versions of Node-red and Node.js are you running?
Does the error occur immediately when Node-red starts up, or when a particular flow is active, or after a few/many messages have been processed?
Is SQL working on a massive data set?
Node red version 4.0.9
Node.js v23.9.0.
It usually crashes after an hour of running. It pull data from control modules per second, process and save them to the sql database
Node 23 is not supported, you should use an lts version. Goo back to 22
Here is node-red startup output ```23 Jul 21:56:47 - [info]
23 Jul 21:56:47 - [info] Node-RED version: v4.0.9
23 Jul 21:56:47 - [info] Node.js version: v23.9.0
23 Jul 21:56:47 - [info] Windows_NT 10.0.22621 x64 LE
23 Jul 21:56:48 - [info] Loading palette nodes
23 Jul 21:56:48 - [info] Dashboard version 3.6.5 started at /SCADA
23 Jul 21:56:49 - [info] Settings file : C:\Users\ENEO.node-red\settings.js
23 Jul 21:56:49 - [info] Context store : 'default' [module=memory]
23 Jul 21:56:49 - [info] User directory : \Users\ENEO.node-red
23 Jul 21:56:49 - [warn] Projects disabled : editorTheme.projects.enabled=false
23 Jul 21:56:49 - [info] Flows file : \Users\ENEO.node-red\flows.json
23 Jul 21:56:49 - [info] Server now running at http://127.0.0.1:1995/
23 Jul 21:56:49 - [warn]
Your flow credentials file is encrypted using a system-generated key.
If the system-generated key is lost for any reason, your credentials
file will not be recoverable, you will have to delete it and re-enter
your credentials.
23 Jul 21:56:49 - [warn] Encrypted credentials not found
23 Jul 21:56:49 - [info] Starting flows
23 Jul 21:56:49 - [info] Started flows
23 Jul 21:56:49 - [info] [sqlitedb:d742df861f936882] opened C:\ENEO\BASEDEDONNEES.db ok
I’ve gone back to lts v22 but still facing the same problem. It is possible to write a code that checks if my node red is running or not and then start it if not already running?
Run it as a service and it will auto restart.
NOTE: This is not addressing the real problem.
You are probably creating backpressure which is exhausting memory. Unless you share more details (like flows and details of what is happening when) it will be hard to advise the correct approach
I have another similar project that I installed since last year, I haven’t experienced any crashes. The project functions in the same way but data are only save to the database after every 5 minutes whereas in this other project, it is after every 1 second. I’m guessing the problem lies with the frequency. I’ve reduced it to 10 minutes and it’s still under observation. I’ll send you the flows
Hello please how can I increase my node.js memory size for node red to handle larger data system?
Probably all that will do is to increase the time before it fails. You need to find why the memory usage is building up. Did it run without failure with the reduced frequency?
No it didn’t
I’m sending you flows of one of my projects
Don't do that please.
Okay, what do you suggest I do?
Here below is the error code
29 Jul 19:20:56 - [info]

Welcome to Node-RED
===================

29 Jul 19:20:56 - [info] Node-RED version: v4.0.9
29 Jul 19:20:56 - [info] Node.js  version: v22.17.1
29 Jul 19:20:56 - [info] Windows_NT 10.0.19045 x64 LE
29 Jul 19:20:57 - [info] Loading palette nodes
29 Jul 19:21:01 - [info] Dashboard version 3.6.5 started at /SCADA
29 Jul 19:21:01 - [info] Settings file  : C:\Users\CT Bertoua\.node-red\settings.js
29 Jul 19:21:01 - [info] Context store  : 'default' [module=memory]
29 Jul 19:21:01 - [info] User directory : \Users\CT Bertoua\.node-red
29 Jul 19:21:01 - [warn] Projects disabled : editorTheme.projects.enabled=false
29 Jul 19:21:01 - [info] Flows file     : \Users\CT Bertoua\.node-red\flows.json
29 Jul 19:21:01 - [info] Server now running at http://127.0.0.1:1995/
29 Jul 19:21:01 - [warn]

---------------------------------------------------------------------
Your flow credentials file is encrypted using a system-generated key.

If the system-generated key is lost for any reason, your credentials
file will not be recoverable, you will have to delete it and re-enter
your credentials.

You should set your own key using the 'credentialSecret' option in
your settings file. Node-RED will then re-encrypt your credentials
file using your chosen key the next time you deploy a change.
---------------------------------------------------------------------

29 Jul 19:21:01 - [warn] Encrypted credentials not found
29 Jul 19:21:02 - [info] Starting flows
29 Jul 19:21:03 - [info] Started flows
29 Jul 19:21:03 - [info] [sqlitedb:88ff7c5c62c88f00] opened C:\ENEO\BASEDEDONNEES.db ok

<--- Last few GCs --->

[6008:000001BCB04B5000]  3406352 ms: Mark-Compact 1965.2 (2037.4) -> 1949.2 (2037.7) MB, pooled: 2 MB, 1109.81 / 0.00 ms  (average mu = 0.118, current mu = 0.073) allocation failure; scavenge might not succeed
[6008:000001BCB04B5000]  3407700 ms: Mark-Compact 1965.2 (2037.9) -> 1948.7 (2038.4) MB, pooled: 1 MB, 1178.00 / 0.00 ms  (average mu = 0.122, current mu = 0.126) allocation failure; scavenge might not succeed


<--- JS stacktrace --->

FATAL ERROR: Ineffective mark-compacts near heap limit Allocation failed - JavaScript heap out of memory
----- Native stack trace -----

 1: 00007FF621E30CD7 node::SetCppgcReference+16599
 2: 00007FF621D94568 v8::base::CPU::num_virtual_address_bits+103336
 3: 00007FF6229053B1 v8::Isolate::ReportExternalAllocationLimitReached+65
 4: 00007FF6228F1F36 v8::Function::Experimental_IsNopFunction+3302
 5: 00007FF62274E870 v8::internal::StrongRootAllocatorBase::StrongRootAllocatorBase+33904
 6: 00007FF622747CBA v8::internal::StrongRootAllocatorBase::StrongRootAllocatorBase+6330
 7: 00007FF6227434F5 v8::internal::ThreadIsolation::JitPageReference::Size+190613
 8: 00007FF6220CCF5D BIO_ssl_shutdown+189```
Did it make any difference?
Monitor the memory usage in whatever system monitor is available (I don't use windows) and see whether the memory is building up slowly or suddenly, leading up to the failure?
Not really.
This time around it crashes without any data processing.
I left it ON yesterday at 7 pm and woke up this morning to find it crashed, but non of the generators was in service
Copyright OpenJS Foundation and Node-RED contributors. All rights reserved. The OpenJS Foundation has registered trademarks and uses trademarks. For a list of trademarks of the OpenJS Foundation, please see our Trademark Policy and Trademark List. Trademarks and logos not indicated on the list of OpenJS Foundation trademarks are trademarks™ or registered® trademarks of their respective holders. Use of them does not imply any affiliation with or endorsement by them.
The OpenJS Foundation | Terms of Use | Privacy Policy | OpenJS Foundation Bylaws | Trademark Policy | Trademark List | Cookie Policy