I have been using Node-red in Docker for some time and in the last two days I've started to see higher CPU usage from 11 to 35 %. This starts at 22:00 each day, I've looked at timers etc and all appears to be ok with nothing weird kicking off, as for as I can tell. How I can tell I have Grafana monitor Proxmox and a power monitor of server power, also TOP on the Docker server showing Node-red as the highest.
How can I pin down what is causing this? The Portainer Node-red console isn't much help. It's probably something I've done but can't figure out what !
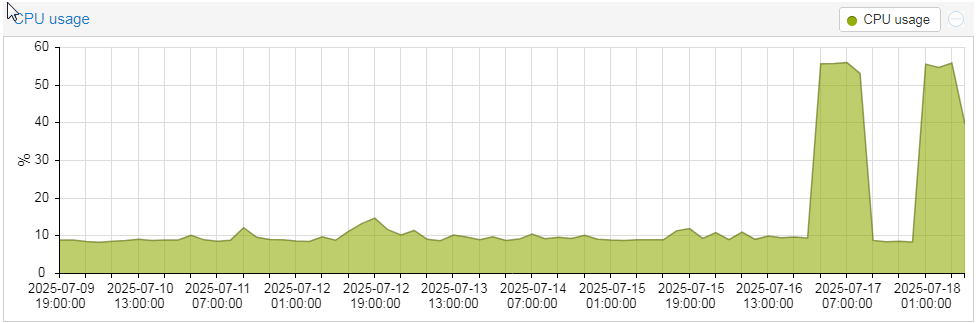
(Normal CPU usage)
You could use chrome dev tools to profile the usage.
How does that work ?
I have Proxmox running a Debian server, running docker which Node-red is one of the dockers. I can't find a way to dig deeper into the node-red docker to see what processes are running and how much cpu.
You have to start node-red in your docker in debug mode. Attach port 9229 to your server. Forward this port to your host with ssh. Then open chrome dev tools and you will see the node process there. Open it a little bit earlier than the time you are seeing spikes, and start profilling the process. Then check which methods are causing the issue. Then find where those methods are being called.
That is $1USD. You're welcome
But if you want me to do the job I can charge $10KUSD
I never knew that, I wonder if Node-red can generate a log itself?. Funnily enough I use Chrome's Dev tools to find websites API's that I use in NR I guess that not the same thing.
Node-RED can't do that. You are profilling a nodejs process, which is where Node-RED is interpreted
Ok, I understand. I tend to think Node-red can do anything - most of the time!.
Sorted, An API call had gone rogue with weirdness maybe a Cloudflare issue. It was called at 06:01 everyday but at 22:00 node-red would start maxing out the CPU.
I thought I would get my 1 USD 
Good you fixed your issue
Oh dear, Sorry, how about 74 Pence ?