Node-Red on RPi restarts after ~2 weeks

Hi, I´m using Node-Red on 4 devices :face_with_hand_over_mouth:

On one RPi I can see Node-Red restarts every few weeks, I saw this line:

Sep 23 09:01:59 openwb kernel: Node 0 active_anon:54128kB inactive_anon:875100kB active_file:1932kB inactive_file:1780kB unevictable:16kB isolated(anon):0kB isolated(file):0kB mapped:2924kB dirty:0kB writeback:0kB shmem:632kB writeback_tmp:0kB kernel_stack:1144kB pagetables:4616kB sec_pagetables:0kB all_unreclaimable? no
Sep 23 09:02:21 openwb systemd[1]: Stopped Node-RED graphical event wiring tool.
Sep 23 09:02:21 openwb systemd[1]: Started Node-RED graphical event wiring tool.
Sep 23 09:02:27 openwb Node-RED[6628]: 23 Sep 09:02:27 - [info]
Sep 23 09:02:27 openwb Node-RED[6628]: Willkommen bei Node-RED
Sep 23 09:02:27 openwb Node-RED[6628]: ===================
Sep 23 09:02:27 openwb Node-RED[6628]: 23 Sep 09:02:27 - [info] Node-RED Version: v4.0.2
Sep 23 09:02:27 openwb Node-RED[6628]: 23 Sep 09:02:27 - [info] Node.js  Version: v18.20.4
Sep 23 09:02:27 openwb Node-RED[6628]: 23 Sep 09:02:27 - [info] Linux 6.1.21-v7+ arm LE

What could this be?
a problem with the RAM?

greetings

What is in the log preceding that message? You should be able to look in /var/log/syslog or /var/log/syslog.1

you are right:

Sep 23 09:01:59 openwb kernel: [1162407.298766] node-red invoked oom-killer: gfp_mask=0x140cca(GFP_HIGHUSER_MOVABLE|__GFP_COMP), order=0, oom_score_adj=0
Sep 23 09:01:59 openwb kernel: [1162407.298811] CPU: 0 PID: 392 Comm: node-red Tainted: G         C         6.1.21-v7+ #1642
Sep 23 09:01:59 openwb kernel: [1162407.298827] Hardware name: BCM2835
Sep 23 09:01:59 openwb kernel: [1162407.298843]  unwind_backtrace from show_stack+0x18/0x1c
Sep 23 09:01:59 openwb kernel: [1162407.298878]  show_stack from dump_stack_lvl+0x68/0x8c
Sep 23 09:01:59 openwb kernel: [1162407.298902]  dump_stack_lvl from dump_header+0x54/0x214
Sep 23 09:01:59 openwb kernel: [1162407.298929]  dump_header from oom_kill_process+0x238/0x244
Sep 23 09:01:59 openwb kernel: [1162407.298961]  oom_kill_process from out_of_memory+0x288/0x358
Sep 23 09:01:59 openwb kernel: [1162407.298990]  out_of_memory from __alloc_pages+0x7c4/0xf9c
Sep 23 09:01:59 openwb kernel: [1162407.299023]  __alloc_pages from __filemap_get_folio+0x184/0x610
Sep 23 09:01:59 openwb kernel: [1162407.299051]  __filemap_get_folio from filemap_fault+0x884/0xd38
Sep 23 09:01:59 openwb kernel: [1162407.299073]  filemap_fault from __do_fault+0x40/0x188
Sep 23 09:01:59 openwb kernel: [1162407.299096]  __do_fault from handle_mm_fault+0xafc/0xeac
Sep 23 09:01:59 openwb kernel: [1162407.299118]  handle_mm_fault from do_page_fault+0x144/0x39c
Sep 23 09:01:59 openwb kernel: [1162407.299148]  do_page_fault from do_PrefetchAbort+0x40/0x94
Sep 23 09:01:59 openwb kernel: [1162407.299174]  do_PrefetchAbort from ret_from_exception+0x0/0x28
Sep 23 09:01:59 openwb kernel: [1162407.299194] Exception stack(0xbea55fb0 to 0xbea55ff8)
Sep 23 09:01:59 openwb kernel: [1162407.299208] 5fa0:                                     052c29b0 7eb380f4 00000002 fffffffe
Sep 23 09:01:59 openwb kernel: [1162407.299222] 5fc0: 052c29b0 052c29b0 052c29b0 7eb380f8 00000000 052ea318 5f4d5c21 7eb37ff4
Sep 23 09:01:59 openwb kernel: [1162407.299236] 5fe0: ffffffff 7eb37fd8 00cb9de4 00a61b80 60000010 ffffffff
Sep 23 09:01:59 openwb kernel: [1162407.299265] Mem-Info:
Sep 23 09:01:59 openwb kernel: [1162407.299273] active_anon:13532 inactive_anon:218775 isolated_anon:0
Sep 23 09:01:59 openwb kernel: [1162407.299273]  active_file:483 inactive_file:420 isolated_file:32
Sep 23 09:01:59 openwb kernel: [1162407.299273]  unevictable:4 dirty:0 writeback:0
Sep 23 09:01:59 openwb kernel: [1162407.299273]  slab_reclaimable:3241 slab_unreclaimable:3387
Sep 23 09:01:59 openwb kernel: [1162407.299273]  mapped:731 shmem:158 pagetables:1154
Sep 23 09:01:59 openwb kernel: [1162407.299273]  sec_pagetables:0 bounce:0
Sep 23 09:01:59 openwb kernel: [1162407.299273]  kernel_misc_reclaimable:0
Sep 23 09:01:59 openwb kernel: [1162407.299273]  free:4549 free_pcp:116 free_cma:39
Sep 23 09:01:59 openwb kernel: [1162407.299304] Node 0 active_anon:54128kB inactive_anon:875100kB active_file:1932kB inactive_file:1780kB unevictable:16kB isolated(anon):0kB isolated(file):0kB mapped:2924kB dirty:0kB writeback:0kB shmem:632kB writeback_tmp:0kB kernel_stack:1144kB pagetables:4616kB sec_pagetables:0kB all_unreclaimable? no
Sep 23 09:01:59 openwb kernel: [1162407.299332] DMA free:18196kB boost:8192kB min:24576kB low:28672kB high:32768kB reserved_highatomic:0KB active_anon:54128kB inactive_anon:875100kB active_file:1860kB inactive_file:2476kB unevictable:16kB writepending:0kB present:1021952kB managed:994824kB mlocked:16kB bounce:0kB free_pcp:464kB local_pcp:0kB free_cma:156kB
Sep 23 09:01:59 openwb kernel: [1162407.299363] lowmem_reserve[]: 0 0 0
Sep 23 09:01:59 openwb kernel: [1162407.299412] DMA: 884*4kB (UMEC) 460*8kB (UMEC) 322*16kB (UME) 129*32kB (UME) 31*64kB (UME) 0*128kB 0*256kB 0*512kB 0*1024kB 0*2048kB 0*4096kB = 18480kB
Sep 23 09:01:59 openwb kernel: [1162407.299516] 4600 total pagecache pages
Sep 23 09:01:59 openwb kernel: [1162407.299534] 3500 pages in swap cache
Sep 23 09:01:59 openwb kernel: [1162407.299541] Free swap  = 0kB
Sep 23 09:01:59 openwb kernel: [1162407.299547] Total swap = 102396kB
Sep 23 09:01:59 openwb kernel: [1162407.299554] 255488 pages RAM
Sep 23 09:01:59 openwb kernel: [1162407.299560] 0 pages HighMem/MovableOnly
Sep 23 09:01:59 openwb kernel: [1162407.299566] 6782 pages reserved
Sep 23 09:01:59 openwb kernel: [1162407.299572] 65536 pages cma reserved
Sep 23 09:01:59 openwb kernel: [1162407.299578] Tasks state (memory values in pages):
Sep 23 09:01:59 openwb kernel: [1162407.299585] [  pid  ]   uid  tgid total_vm      rss pgtables_bytes swapents oom_score_adj name
Sep 23 09:01:59 openwb kernel: [1162407.299611] [    136]     0   136    11428       98    43008       72          -250 systemd-journal
Sep 23 09:01:59 openwb kernel: [1162407.299629] [    167]     0   167     4990       31    18432      336         -1000 systemd-udevd
Sep 23 09:01:59 openwb kernel: [1162407.299646] [    268]   103   268     5572       28    24576      109             0 systemd-timesyn
Sep 23 09:01:59 openwb kernel: [1162407.299665] [    382]   108   382     1727       51    14336       41             0 avahi-daemon
Sep 23 09:01:59 openwb kernel: [1162407.299682] [    383]     0   383     2049       19    18432       34             0 cron
Sep 23 09:01:59 openwb kernel: [1162407.299698] [    384]   104   384     1949      107    16384       36          -900 dbus-daemon
Sep 23 09:01:59 openwb kernel: [1162407.299714] [    392]  1000   392   291318   227742  1746944    19927             0 node-red
Sep 23 09:01:59 openwb kernel: [1162407.299731] [    393]     0   393     9889       68    26624       79             0 polkitd
Sep 23 09:01:59 openwb kernel: [1162407.299747] [    394]   108   394     1688       12    14336       53             0 avahi-daemon
Sep 23 09:01:59 openwb kernel: [1162407.299764] [    400]     0   400     6635       63    24576      120             0 rsyslogd
Sep 23 09:01:59 openwb kernel: [1162407.299780] [    404]     0   404     3257       88    22528       62             0 systemd-logind
Sep 23 09:01:59 openwb kernel: [1162407.299796] [    407] 65534   407     1327        5    14336       42             0 thd
Sep 23 09:01:59 openwb kernel: [1162407.299813] [    411]     0   411     2948       12    20480       90             0 wpa_supplicant
Sep 23 09:01:59 openwb kernel: [1162407.299829] [    452]     0   452     7179       22    18432       13             0 rngd
Sep 23 09:01:59 openwb kernel: [1162407.299846] [    472]     0   472    12148       80    40960      232             0 ModemManager
Sep 23 09:01:59 openwb kernel: [1162407.299862] [    473]     0   473     1120        0    12288       25             0 agetty
Sep 23 09:01:59 openwb kernel: [1162407.299878] [    482]     0   482     3100       36    18432      134         -1000 sshd
Sep 23 09:01:59 openwb kernel: [1162407.299895] [    621]     0   621      700       42    10240       42             0 dhcpcd
Sep 23 09:01:59 openwb kernel: [1162407.299911] [    724]  1000   724     1941        2    16384       40             0 nrgpio
Sep 23 09:01:59 openwb kernel: [1162407.299928] [    726]  1000   726     1941        2    16384       40             0 nrgpio
Sep 23 09:01:59 openwb kernel: [1162407.299944] [    727]  1000   727     3739        0    20480      635             0 python3
Sep 23 09:01:59 openwb kernel: [1162407.299961] [    729]  1000   729     3739        3    24576      635             0 python3
Sep 23 09:01:59 openwb kernel: [1162407.299978] [    730]  1000   730     1941        2    14336       40             0 nrgpio
Sep 23 09:01:59 openwb kernel: [1162407.299994] [    732]  1000   732     1941        2    14336       40             0 nrgpio
Sep 23 09:01:59 openwb kernel: [1162407.300010] [    733]  1000   733     3739        0    24576      635             0 python3
Sep 23 09:01:59 openwb kernel: [1162407.300027] [    735]  1000   735     1941        2    14336       40             0 nrgpio
Sep 23 09:01:59 openwb kernel: [1162407.300043] [    736]  1000   736     3739        0    22528      635             0 python3
Sep 23 09:01:59 openwb kernel: [1162407.300060] [    738]  1000   738     3739        0    22528      635             0 python3
Sep 23 09:01:59 openwb kernel: [1162407.300076] [    739]  1000   739     1941        2    14336       40             0 nrgpio
Sep 23 09:01:59 openwb kernel: [1162407.300093] [    741]  1000   741     6044        0    24576      638             0 python3
Sep 23 09:01:59 openwb kernel: [1162407.300116] oom-kill:constraint=CONSTRAINT_NONE,nodemask=(null),cpuset=/,mems_allowed=0,global_oom,task_memcg=/,task=node-red,pid=392,uid=1000
Sep 23 09:01:59 openwb kernel: [1162407.300238] Out of memory: Killed process 392 (node-red) total-vm:1165272kB, anon-rss:909680kB, file-rss:1288kB, shmem-rss:0kB, UID:1000 pgtables:1706kB oom_score_adj:0
Sep 23 09:02:00 openwb systemd[1]: nodered.service: Main process exited, code=killed, status=9/KILL
Sep 23 09:02:01 openwb systemd[1]: nodered.service: Failed with result 'signal'.
Sep 23 09:02:01 openwb systemd[1]: nodered.service: Consumed 2d 8h 5min 10.149s CPU time.
Sep 23 09:02:19 openwb dhcpcd[621]: eth0: Router Advertisement from fe80:..
Sep 23 09:02:21 openwb systemd[1]: nodered.service: Scheduled restart job, restart counter is at 1.
Sep 23 09:02:21 openwb systemd[1]: Stopped Node-RED graphical event wiring tool.
Sep 23 09:02:21 openwb systemd[1]: nodered.service: Consumed 2d 8h 5min 10.149s CPU time.
Sep 23 09:02:21 openwb systemd[1]: Started Node-RED graphical event wiring tool.
Sep 23 09:02:27 openwb Node-RED[6628]: 23 Sep 09:02:27 - [info]
Sep 23 09:02:27 openwb Node-RED[6628]: Willkommen bei Node-RED

It appears that node-red has gobbled up all the memory for some reason. Are you handling any large objects in memory, images or video possibly, or reading in large files?

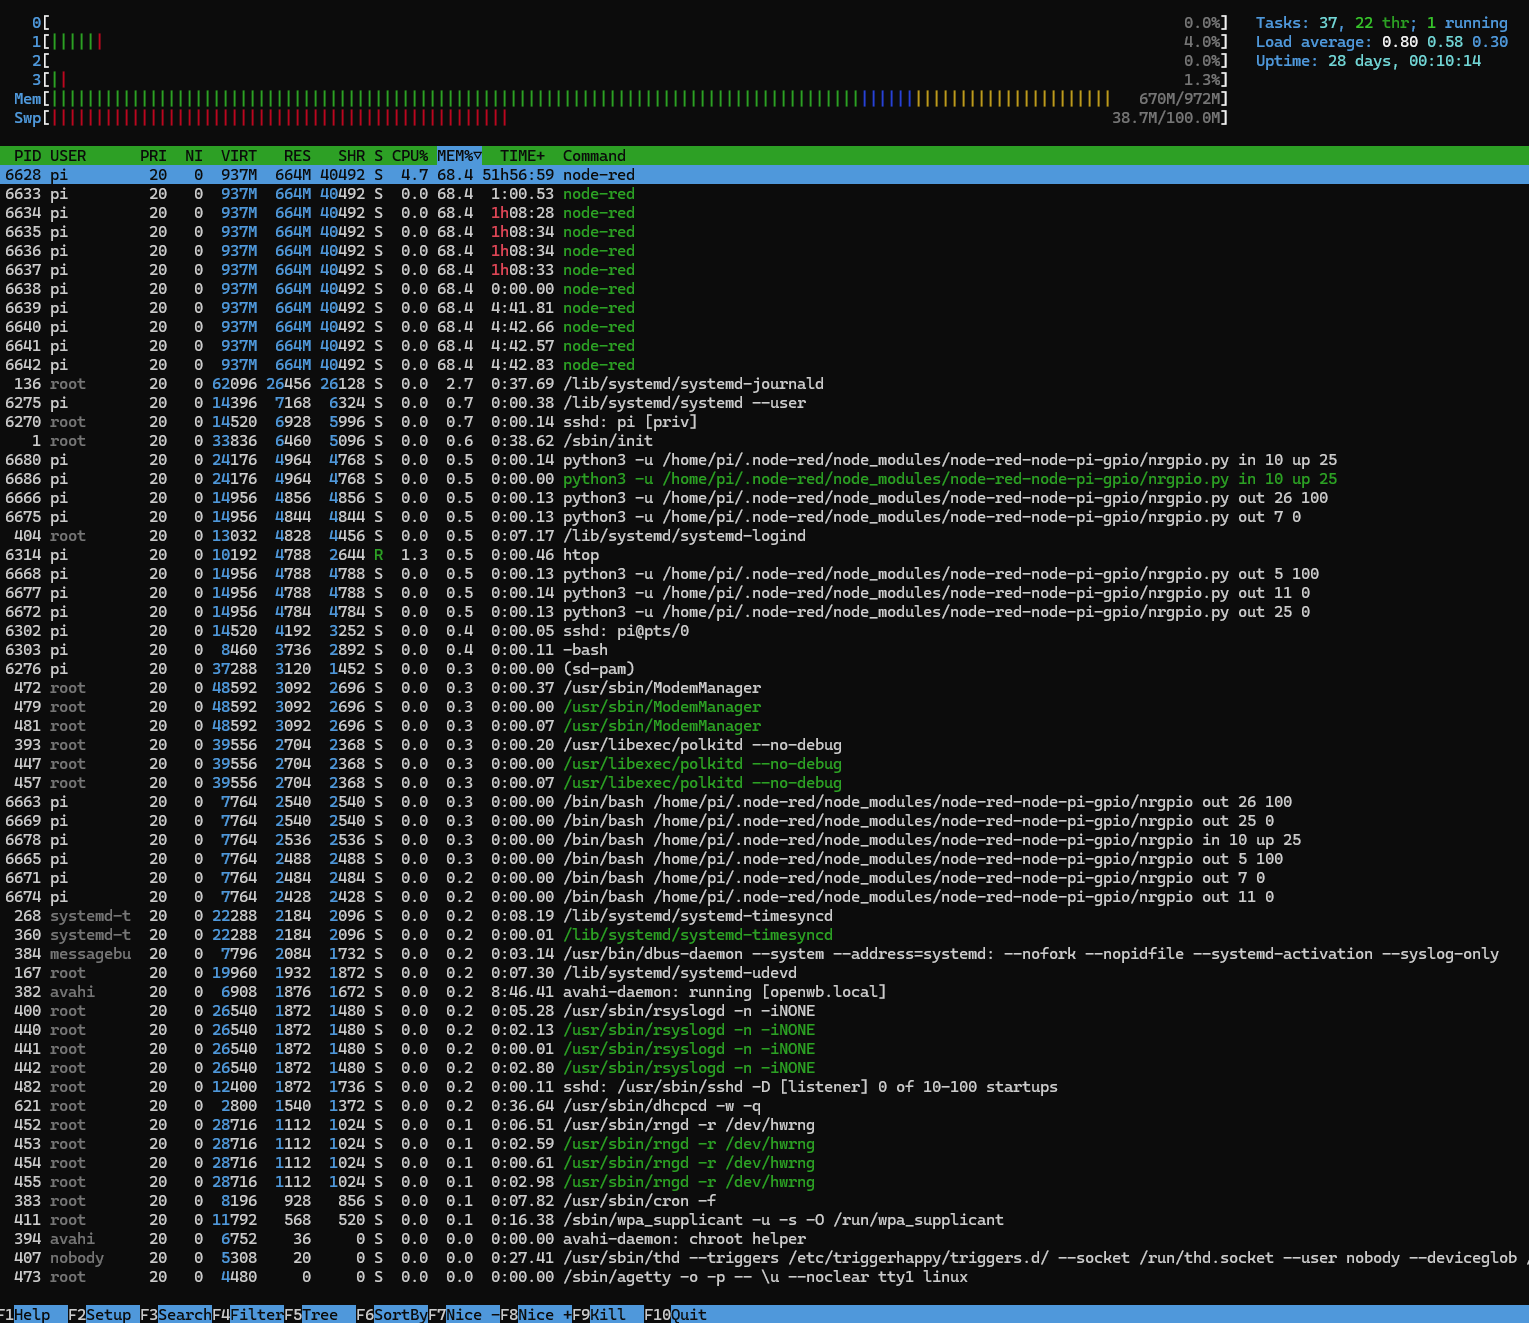
You could use top or htop to monitor the memory usage over a period and see if it is increasing steadily. Another possibility is that occasionally something happens that ends up in some sort of loop grabbing hold of extra memory so that the memory requirement increases rapidly and causes the failure.

Hey Colin,
I don´t handle any large objects or reading in large files!
Ram stays since days at:


So it remains a mystery

it does look like you are sending 10s resolution data to a chart. That is 120960 samples in 2 weeks, per data point.

How big does that chart get? Does it show 1 day, 1 week, 2 weeks, infinite?

Do you have many more charts than this?

i have 6 charts:
6h, 2h, 2h, others 15min.

10s is right, some charts get sometimes no data

want to see the whole flow?

No thanks :slight_smile:

But if you could do a quick estimate:

for each chart - (60/freq) * (60 * hours), then multiply by line count for total.

example: for every 10s, max 6h, 2 lines = (60 / 10) * (60 * 6) = 2160 data points per line, 4320 points total

What are the points per line & totals of your graphs?

If any of your charts have more points on a line than the screen can physically display, its a little bit pointless and wasteful & is often the cause of users memory issues - though to be fair, the numbers you are talking about here, I dont expect that to be a huge issue (unless there is a bug in the chart and data is simply accumulating for ever)

I´ve disabled the charts now, I think I remember two of them look strange sometimes.
when they get no data, they didn´t delete points after 2h.
since they are unimportant anyway, I'm going to test for a few weeks without them.
I'll get back

12 days gone... today I looked at the RAM:

I´ve disabled all charts except this:

Can I find out why Node-Red uses so much RAM after ~12days ?

I´ve many RPi/VM with Node-Red, they all stays at <50%

One of them has 99% exact the same flow and 100% same RPi model.

Not really addressing your question, but it might be interesting to see if the problem stays with the machine or travels with the SD/SSD if you swap the disks between these two Pies.

If you have static or reserved IPs for these two you may have to swap those too.

Are the SDs also identical - make, model & size?

What does top show?
What sort of pi is it?

@jbudd the other Pi is located somewhere else entirely and does not belong to me (customer), and it is in productive use. I can just look in ssh.
model is the same, 3B+ both 16gb sd card.

@Colin I have to wait again ~12 days, yesterday I´ve updated & reboot. today (after 9h uptime) RAM use is 33%.

You won't have to wait that long. If the 24.7% MEM figure for node red increases regularly each day then you have a problem.

today, after 3 days: 29,2%
it remains exciting

after 5 days Node-Red takes 36,5% Ram

on the other system Node-Red only takes 29,5% Ram after 13 days.

can I debug somewhere, why Node-Red takes to much Ram or what in Node-Red takes it?

my system use two modbus requests and gpios, the other not.
one modbus device makes some erros:

sudo journalctl --since "24 hour ago" | grep "Node"
Okt 12 21:15:55 openwb Node-RED[392]: 12 Oct 21:15:55 - [warn] [modbus-getter:1000 - 1003] Modbus Failure On State sending Get More About It By Logging
Okt 12 21:15:55 openwb Node-RED[392]: 12 Oct 21:15:55 - [error] [modbus-getter:1000 - 1003] Error: Timed out
Okt 12 23:34:56 openwb Node-RED[392]: 12 Oct 23:34:56 - [warn] [modbus-getter:1000 - 1003] Modbus Failure On State sending Get More About It By Logging
Okt 12 23:34:56 openwb Node-RED[392]: 12 Oct 23:34:56 - [error] [modbus-getter:1000 - 1003] Error: Timed out
Okt 12 23:35:46 openwb Node-RED[392]: 12 Oct 23:35:46 - [warn] [modbus-getter:1000 - 1003] Modbus Failure On State sending Get More About It By Logging
Okt 12 23:35:46 openwb Node-RED[392]: 12 Oct 23:35:46 - [error] [modbus-getter:1000 - 1003] Error: Timed out
Okt 13 00:22:56 openwb Node-RED[392]: 13 Oct 00:22:56 - [warn] [modbus-getter:1000 - 1003] Modbus Failure On State sending Get More About It By Logging
Okt 13 00:22:56 openwb Node-RED[392]: 13 Oct 00:22:56 - [error] [modbus-getter:1000 - 1003] Error: Timed out
Okt 13 00:49:46 openwb Node-RED[392]: 13 Oct 00:49:46 - [warn] [modbus-getter:1000 - 1003] Modbus Failure On State sending Get More About It By Logging
Okt 13 00:49:46 openwb Node-RED[392]: 13 Oct 00:49:46 - [error] [modbus-getter:1000 - 1003] Error: Timed out
Okt 13 01:01:26 openwb Node-RED[392]: 13 Oct 01:01:26 - [warn] [modbus-getter:1000 - 1003] Modbus Failure On State sending Get More About It By Logging
Okt 13 01:01:26 openwb Node-RED[392]: 13 Oct 01:01:26 - [error] [modbus-getter:1000 - 1003] Error: Timed out
Okt 13 05:52:57 openwb Node-RED[392]: 13 Oct 05:52:57 - [warn] [modbus-getter:1000 - 1003] Modbus Failure On State sending Get More About It By Logging
Okt 13 05:52:57 openwb Node-RED[392]: 13 Oct 05:52:57 - [error] [modbus-getter:1000 - 1003] Error: Timed out
Okt 13 07:32:38 openwb Node-RED[392]: 13 Oct 07:32:38 - [warn] [modbus-getter:1000 - 1003] Modbus Failure On State sending Get More About It By Logging
Okt 13 07:32:38 openwb Node-RED[392]: 13 Oct 07:32:38 - [error] [modbus-getter:1000 - 1003] Error: Timed out
Okt 13 08:02:18 openwb Node-RED[392]: 13 Oct 08:02:18 - [warn] [modbus-getter:1000 - 1003] Modbus Failure On State sending Get More About It By Logging
Okt 13 08:02:18 openwb Node-RED[392]: 13 Oct 08:02:18 - [error] [modbus-getter:1000 - 1003] Error: Timed out
Okt 13 08:14:48 openwb Node-RED[392]: 13 Oct 08:14:48 - [warn] [modbus-getter:1000 - 1003] Modbus Failure On State sending Get More About It By Logging
Okt 13 08:14:48 openwb Node-RED[392]: 13 Oct 08:14:48 - [error] [modbus-getter:1000 - 1003] Error: Timed out
Okt 13 08:33:38 openwb Node-RED[392]: 13 Oct 08:33:38 - [warn] [modbus-getter:1000 - 1003] Modbus Failure On State sending Get More About It By Logging
Okt 13 08:33:38 openwb Node-RED[392]: 13 Oct 08:33:38 - [error] [modbus-getter:1000 - 1003] Error: Timed out
Okt 13 08:36:28 openwb Node-RED[392]: 13 Oct 08:36:28 - [warn] [modbus-getter:1000 - 1003] Modbus Failure On State sending Get More About It By Logging
Okt 13 08:36:28 openwb Node-RED[392]: 13 Oct 08:36:28 - [error] [modbus-getter:1000 - 1003] Error: Timed out
Okt 13 09:02:28 openwb Node-RED[392]: 13 Oct 09:02:28 - [warn] [modbus-getter:1000 - 1003] Modbus Failure On State sending Get More About It By Logging
Okt 13 09:02:28 openwb Node-RED[392]: 13 Oct 09:02:28 - [error] [modbus-getter:1000 - 1003] Error: Timed out
Okt 13 16:31:02 openwb Node-RED[392]: 13 Oct 16:31:02 - [warn] [modbus-getter:1000 - 1003] Modbus Failure On State sending Get More About It By Logging
Okt 13 16:31:02 openwb Node-RED[392]: 13 Oct 16:31:02 - [error] [modbus-getter:1000 - 1003] Error: Timed out
Okt 13 17:11:22 openwb Node-RED[392]: 13 Oct 17:11:22 - [warn] [modbus-getter:1000 - 1003] Modbus Failure On State sending Get More About It By Logging
Okt 13 17:11:22 openwb Node-RED[392]: 13 Oct 17:11:22 - [error] [modbus-getter:1000 - 1003] Error: Timed out
Okt 13 17:16:42 openwb Node-RED[392]: 13 Oct 17:16:42 - [warn] [modbus-getter:1000 - 1003] Modbus Failure On State sending Get More About It By Logging
Okt 13 17:16:42 openwb Node-RED[392]: 13 Oct 17:16:42 - [error] [modbus-getter:1000 - 1003] Error: Timed out
Okt 13 17:58:42 openwb Node-RED[392]: 13 Oct 17:58:42 - [warn] [modbus-getter:1000 - 1003] Modbus Failure On State sending Get More About It By Logging
Okt 13 17:58:42 openwb Node-RED[392]: 13 Oct 17:58:42 - [error] [modbus-getter:1000 - 1003] Error: Timed out
Okt 13 19:09:12 openwb Node-RED[392]: 13 Oct 19:09:12 - [warn] [modbus-getter:1000 - 1003] Modbus Failure On State sending Get More About It By Logging
Okt 13 19:09:12 openwb Node-RED[392]: 13 Oct 19:09:12 - [error] [modbus-getter:1000 - 1003] Error: Timed out
Okt 13 19:26:52 openwb Node-RED[392]: 13 Oct 19:26:52 - [warn] [modbus-getter:1000 - 1003] Modbus Failure On State sending Get More About It By Logging
Okt 13 19:26:52 openwb Node-RED[392]: 13 Oct 19:26:52 - [error] [modbus-getter:1000 - 1003] Error: Timed out
Okt 13 20:05:03 openwb Node-RED[392]: 13 Oct 20:05:03 - [warn] [modbus-getter:1000 - 1003] Modbus Failure On State sending Get More About It By Logging
Okt 13 20:05:03 openwb Node-RED[392]: 13 Oct 20:05:03 - [error] [modbus-getter:1000 - 1003] Error: Timed out

(24h)

Do these errors cause the memory to increase so much?


edit: I think not => 41min later:

just edited some text nodes

what about all those nrgpio processes ? some are running under python, some under bash.
does the node-red-node-pi-gpio node spawn python processes ?

I´ve made a new install on a new sd-card with raspian bookworm, to rule out that it was anything other than node-red.

Of course it´s the same:


after a few days ram rises over the "max old space" border.
for my understanding node-red must never exceed more than 26% of ram.

would it be possible, that an expert like @Colin or @Steve-Mcl take a look on my node-red ?
(login data via pm)

I'm at my wits' end.

another RPi from me has gpio nodes too and much more modbus devices:


absolutely no problems with ram!

There must be something significantly different in the flows on the system which leaks memory and those the don't.
Check the versions of node-red, all nodes, and nodejs.
Are there any extra nodes used in the failing one that are not used in the others?

the newest
Node-RED Version: v4.0.5
Node.js Version: v20.18.0
Linux 6.6.51+rpt-rpi-v7 arm LE

no

maybe you can check my flow:
flows.json (270.9 KB)
without incoming data ?
and tell me who could be the mem killer