Parsing MySQL data to dashboard

Hello.
Need help with parsing array data from MySQL and show it in dashboard without using node-red-node-ui-table (because im using Node-RED 0.18.1 and dashboard 2.8.0 and seems its not compatible with this plugin).
What I have:

  1. I have sensors that transmit readings (temperature and humidity) to the server
  2. Data from these sensors are saved in MySQL in this form
  3. In Node-RED using the command
SELECT * FROM datchik2 WHERE date = '{{payload}}';

I read data from the database for the desired day
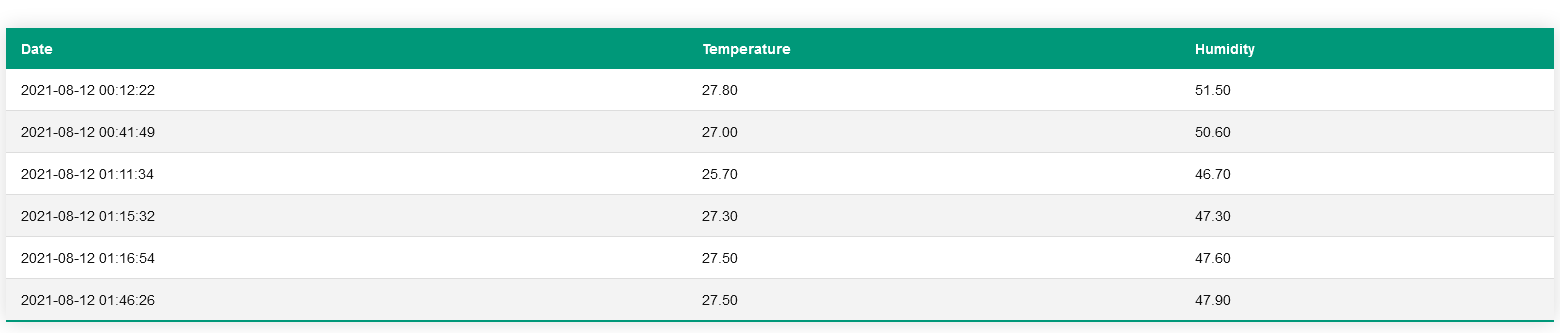
4. Data from the database comes in this form
[{"date":"2021-08-12","time":"00:12:22","temp":"27.80","hum":"51.50","timestamp":"1628716342"},{"date":"2021-08-12","time":"00:41:49","temp":"27.00","hum":"50.60","timestamp":"1628718109"},{"date":"2021-08-12","time":"01:11:34","temp":"25.70","hum":"46.70","timestamp":"1628719894"},{"date":"2021-08-12","time":"01:15:32","temp":"27.30","hum":"47.30","timestamp":"1628720132"},{"date":"2021-08-12","time":"01:16:54","temp":"27.50","hum":"47.60","timestamp":"1628720214"},{"date":"2021-08-12","time":"01:46:26","temp":"27.50","hum":"47.90","timestamp":"1628721986"}]
Screenshot 2021-08-12 022525
4. And finally i want do display this data in dashboard in some convenient form where you would see the time of reading the data and the readings themselves during this time

Due to certain reasons, I can't use node-id-node-uitable, so I'm looking for any other way to visually see the data.
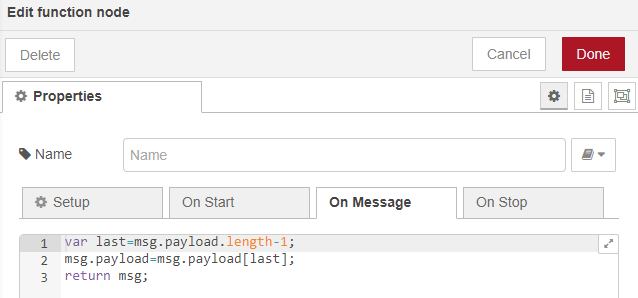
At the moment with my own efforts I was able to parse the data and display only one specific reading of the selected date with this function:

msg1 = {"topic":"temp", "payload":msg.payload[0].temp};
return [msg1];


Screenshot 2021-08-12 023806

Need help with both parsing and showing data in dashboard...
Thanks!

Thats very old version .. do you at least have the ui-template node ? :wink:

Here's an example from your db data and with the use of Angular's ng-repeat loops through the msg.payload array to create the rows.

[{"id":"16385d687d066673","type":"inject","z":"4895ea10b4ee9ead","name":"db data","props":[{"p":"payload"},{"p":"topic","vt":"str"}],"repeat":"","crontab":"","once":false,"onceDelay":0.1,"topic":"","payload":"[{\"date\":\"2021-08-12\",\"time\":\"00:12:22\",\"temp\":\"27.80\",\"hum\":\"51.50\",\"timestamp\":\"1628716342\"},{\"date\":\"2021-08-12\",\"time\":\"00:41:49\",\"temp\":\"27.00\",\"hum\":\"50.60\",\"timestamp\":\"1628718109\"},{\"date\":\"2021-08-12\",\"time\":\"01:11:34\",\"temp\":\"25.70\",\"hum\":\"46.70\",\"timestamp\":\"1628719894\"},{\"date\":\"2021-08-12\",\"time\":\"01:15:32\",\"temp\":\"27.30\",\"hum\":\"47.30\",\"timestamp\":\"1628720132\"},{\"date\":\"2021-08-12\",\"time\":\"01:16:54\",\"temp\":\"27.50\",\"hum\":\"47.60\",\"timestamp\":\"1628720214\"},{\"date\":\"2021-08-12\",\"time\":\"01:46:26\",\"temp\":\"27.50\",\"hum\":\"47.90\",\"timestamp\":\"1628721986\"}]","payloadType":"json","x":350,"y":580,"wires":[["667fc249772d1731","dd281f4b964c7c96"]]},{"id":"dd281f4b964c7c96","type":"ui_template","z":"4895ea10b4ee9ead","group":"fe8bd71ec6128157","name":"","order":1,"width":"29","height":"10","format":"<style>\n    .styled-table {\n        border-collapse: collapse;\n        margin: 25px 0;\n        font-size: 0.9em;\n        font-family: sans-serif;\n        min-width: 400px;\n        box-shadow: 0 0 20px rgba(0, 0, 0, 0.15);\n    }\n\n    .styled-table thead tr {\n        background-color: #009879;\n        color: #ffffff;\n        text-align: left;\n    }\n\n    .styled-table th,\n    .styled-table td {\n        padding: 12px 15px;\n    }\n\n    .styled-table tbody tr {\n        border-bottom: 1px solid #dddddd;\n    }\n\n    .styled-table tbody tr:nth-of-type(even) {\n        background-color: #f3f3f3;\n    }\n\n    .styled-table tbody tr:last-of-type {\n        border-bottom: 2px solid #009879;\n    }\n</style>\n\n\n<table class=\"styled-table\">\n    <thead>\n        <tr>\n            <th>Date</th>\n            <th>Temperature</th>\n            <th>Humidity</th>\n        </tr>\n    </thead>\n    <tbody>\n        <tr ng-repeat=\"x in msg.payload\">\n            <td>{{ x.date }} {{x.time}}</td>\n            <td>{{x.temp}}</td>\n            <td>{{x.hum}}</td>\n        </tr>\n    </tbody>\n</table>","storeOutMessages":true,"fwdInMessages":true,"resendOnRefresh":true,"templateScope":"local","x":580,"y":580,"wires":[[]]},{"id":"667fc249772d1731","type":"debug","z":"4895ea10b4ee9ead","name":"1","active":true,"tosidebar":true,"console":false,"tostatus":false,"complete":"payload","targetType":"msg","statusVal":"","statusType":"auto","x":450,"y":520,"wires":[]},{"id":"fe8bd71ec6128157","type":"ui_group","name":"Table","tab":"ff25ab1d26c005a4","order":1,"disp":true,"width":"30","collapse":false},{"id":"ff25ab1d26c005a4","type":"ui_tab","name":"Table","icon":"dashboard","disabled":false,"hidden":false}]

2 Likes

Maybe you can try function node as below.
image

[{"id":"54e8e172.d5022","type":"function","z":"330fd06b.d297a","g":"b2c564a3.48a5d8","name":"","func":"var last=msg.payload.length-1;\nmsg.payload=msg.payload[last];\nreturn msg;","outputs":1,"noerr":0,"initialize":"","finalize":"","libs":,"x":940,"y":1760,"wires":[["3da50367.f5a32c"]]}]

1 Like

@UnborN Thanks so much Andy, works perfectly!
And yea dashboard 2.8.0 have ui-template :relaxed:
Just edited slightly your flow to much my project and works awesome! While I was figuring out what was what, it became clear which parameter is responsible for what and how the table itself is drawn, thanks for the experience!

1 Like

This topic was automatically closed 14 days after the last reply. New replies are no longer allowed.