Pie Chart whitin a SVG Dashboard

Hi Dears,

I'm using a ui-SVG contrib to implement a kind of SCADA (Supervisory Control of Automation), and I need to show a pie chart with two categories within of SVG screen. Is it possible put a svg pie chart that will be renderized dinamically with the data? I have tried but without success.

Thanks

In theory it should be possible. However, not sure how the Dashboard svg node works. If you really only need the SVG stuff and don't really need the rest of Dashboard, have a look at the UIBUILDER svg example. UIBUILDER supports creation of SVG via low-code config should you need it. Or you could build the basic dashboard in static SVG and then use UIBUILDER to update any part as long as you can work out the CSS selector for what you want to update.

BTW, if you are trying to build something more complex with SVG, you might want to look at the D3 library. Again, UIBUILDER allows the use of different front-end libraries and I built a RADAR style display a while back using D3 with some help from the ui.js library from uibuilder.

1 Like

@bobfield,

In case you want to do it with the node-red-contrib-ui-svg node...

You could draw a pie chart with two categories, as a circle with a pie segment on top:

<svg x="0" y="0" height="100%" viewBox="0 0 200 200" width="100%" xmlns="http://www.w3.org/2000/svg" xmlns:svg="http://www.w3.org/2000/svg" xmlns:xlink="http://www.w3.org/1999/xlink">
  <!-- Pie chart (consisting out of a full circle and a circle segment on top of it -->
  <path id="pie_full_circle" style="fill:lightgreen" />
  <path id="pie_segment" style="fill:limegreen" />
</svg>

In this case our viewbox (i.e. the visible part of an infinite big svg drawing) has a height and width of 200 pixels, so in this demo we will draw the circle and pie with center coordinates (100,100). Which means in the middle of our SVG drawing. And I calculate the "d" attribute of both paths in a function node, based on following data:

  • the circle radius
  • the circle center coordinates
  • the start angle of the segment
  • the end angle of the segment

Note that I could have used an SVG circle element, but I use instead a path for both the circle and the segment. Otherwise you had to specify the circle radius and center coordinates both in the function node AND inside the SVG drawing. Which makes it hard to maintain if you want to change something afterwards. By using two paths, the circle radius and center coordinates need only to be specified inside the function node.

In the following demo flow, I inject as payload a percentage. The function node converts the percentage to the end angle of the segment:

[{"id":"cefc97a537a9df53","type":"ui_svg_graphics","z":"c53e793dd2f3be09","group":"6293cddec4b65c5f","order":1,"width":"9","height":"9","svgString":"<svg x=\"0\" y=\"0\" height=\"100%\" viewBox=\"0 0 200 200\" width=\"100%\" xmlns=\"http://www.w3.org/2000/svg\" xmlns:svg=\"http://www.w3.org/2000/svg\" xmlns:xlink=\"http://www.w3.org/1999/xlink\">\n  <!-- Pie chart (consisting out of a full circle and a circle segment on top of it -->\n  <path id=\"pie_full_circle\" style=\"fill:lightgreen\" />\n  <path id=\"pie_segment\" style=\"fill:limegreen\" />\n</svg>","clickableShapes":[],"javascriptHandlers":[],"smilAnimations":[],"bindings":[],"showCoordinates":false,"autoFormatAfterEdit":false,"showBrowserErrors":true,"showBrowserEvents":false,"enableJsDebugging":false,"sendMsgWhenLoaded":false,"noClickWhenDblClick":false,"outputField":"payload","editorUrl":"//drawsvg.org/drawsvg.html","directory":"","panning":"disabled","zooming":"disabled","panOnlyWhenZoomed":false,"doubleClickZoomEnabled":false,"mouseWheelZoomEnabled":false,"dblClickZoomPercentage":150,"cssString":"div.ui-svg svg{\n    color: var(--nr-dashboard-widgetColor);\n    fill: currentColor !important;\n}\ndiv.ui-svg path {\n    fill: inherit;\n}","name":"","x":820,"y":120,"wires":[[]]},{"id":"96d685d613bae445","type":"function","z":"c53e793dd2f3be09","name":"Calculate pie chart paths","func":"// Define the center and radius\nconst centerX = 100;\nconst centerY = 100;\nconst radius = 50;\n\n// Full Circle\nconst fullCirclePath = `M ${centerX - radius}, ${centerY} \n          A ${radius}, ${radius} 0 1, 0 ${centerX + radius}, ${centerY} \n          A ${radius}, ${radius} 0 1, 0 ${centerX - radius}, ${centerY} Z`\n          \n// Segment\nconst segmentStartAngle = 0; // Specify the start angle for the segment\n\nlet segmentPercentage = msg.payload;\n\n// Calculate the segment stop angle based on the percentage from the input messag\nlet segmentStopAngle;\nif (segmentPercentage === 100) {\n  // Handle the case when the percentage is 100%\n  segmentStopAngle = 359.99; // Set it to 360 degrees for a full circle\n} else {\n  segmentStopAngle = (segmentPercentage / 100) * 360;\n}\n\n// Convert angles to radians\nconst segmentStartAngleRad = (segmentStartAngle * Math.PI) / 180;\nconst segmentStopAngleRad = (segmentStopAngle * Math.PI) / 180;\n\n// Calculate the start and end points of the segment arc\nconst segmentStartX = centerX + radius * Math.cos(segmentStartAngleRad);\nconst segmentStartY = centerY + radius * Math.sin(segmentStartAngleRad);\nconst segmentEndX = centerX + radius * Math.cos(segmentStopAngleRad);\nconst segmentEndY = centerY + radius * Math.sin(segmentStopAngleRad);\n\n// Determine the large-arc-flag and sweep-flag for the segment\nconst segmentLargeArcFlag = segmentStopAngle - segmentStartAngle > 180 ? 1 : 0;\nconst segmentSweepFlag = 1;\n\n// Create the path data for the segment\nconst segmentPath = `M ${segmentStartX},${segmentStartY} A ${radius},${radius} 0 ${segmentLargeArcFlag},${segmentSweepFlag} ${segmentEndX},${segmentEndY} L ${centerX},${centerY} Z`;\n\nmsg.payload = [{\n    \"command\": \"set_attribute\",\n    \"selector\": \"#pie_full_circle\",\n    \"attributeName\": \"d\",\n    \"attributeValue\": fullCirclePath\n },\n {\n    \"command\": \"set_attribute\",\n    \"selector\": \"#pie_segment\",\n    \"attributeName\": \"d\",\n    \"attributeValue\": segmentPath\n }]\n\nreturn msg;","outputs":1,"timeout":0,"noerr":0,"initialize":"","finalize":"","libs":[],"x":590,"y":120,"wires":[["cefc97a537a9df53"]]},{"id":"019aeda8ccb43e5a","type":"inject","z":"c53e793dd2f3be09","name":"0%","props":[{"p":"payload"}],"repeat":"","crontab":"","once":true,"onceDelay":0.1,"topic":"","payload":"0","payloadType":"num","x":370,"y":120,"wires":[["96d685d613bae445"]]},{"id":"1133f18615aefcad","type":"inject","z":"c53e793dd2f3be09","name":"25%","props":[{"p":"payload"}],"repeat":"","crontab":"","once":false,"onceDelay":0.1,"topic":"","payload":"25","payloadType":"num","x":370,"y":160,"wires":[["96d685d613bae445"]]},{"id":"e45cfc7c29d3bf30","type":"inject","z":"c53e793dd2f3be09","name":"50%","props":[{"p":"payload"}],"repeat":"","crontab":"","once":false,"onceDelay":0.1,"topic":"","payload":"50","payloadType":"num","x":370,"y":200,"wires":[["96d685d613bae445"]]},{"id":"5d1bb13331a00be0","type":"inject","z":"c53e793dd2f3be09","name":"75%","props":[{"p":"payload"}],"repeat":"","crontab":"","once":false,"onceDelay":0.1,"topic":"","payload":"75","payloadType":"num","x":370,"y":240,"wires":[["96d685d613bae445"]]},{"id":"93432edbf797e7ab","type":"inject","z":"c53e793dd2f3be09","name":"100%","props":[{"p":"payload"}],"repeat":"","crontab":"","once":false,"onceDelay":0.1,"topic":"","payload":"100","payloadType":"num","x":370,"y":280,"wires":[["96d685d613bae445"]]},{"id":"6293cddec4b65c5f","type":"ui_group","name":"Pie chart demo","tab":"db70d53e.369ce8","order":2,"disp":true,"width":"9","collapse":false,"className":""},{"id":"db70d53e.369ce8","type":"ui_tab","name":"Memory usage","icon":"dashboard","disabled":false,"hidden":false}]

Which looks like this:

svg-pie_chart

Have fun with it!

Bart

4 Likes

Hi BartButenaers,

Great. It completely solved my problem. I'm using Inkscape to assemble the SVG monitoring screen. So I took your svg code and created an svg for a pie chart, which I place in several positions on the screen, one for each device. So in logic, just send the desired percentage to each pie graph. It worked wonderfully. Would it be too much to ask if you could teach me the same thing, but with a gauge, or donut chart?

Best Regards,

Roberto

Hi Julian,

I appreciate your attention, but the BartButenaers suggestion solved my problem. However, I will look for the UIBUILDER.

Thanks.

Roberto

No problem, Barts ui svg contribution is excellent and indeed inspired some of the work I did with uibuilder to make sure that it treats svg's properly and lets you remote and locally build and control them.

2 Likes

I think the easiest way to build a donut chart in svg, is by putting a smaller circle on top of the pie chart that we created above:

image

That inner circle needs to have the same center point as the full cirlce, and the same color as your svg background. Which means we are cheating, by hiding a part of the pie chart behind the inner circle.
In the function node you can see a new property donutWidth that is used to calculate the radius of the inner circle:

radius inner circle = radius full circle - donutWidth

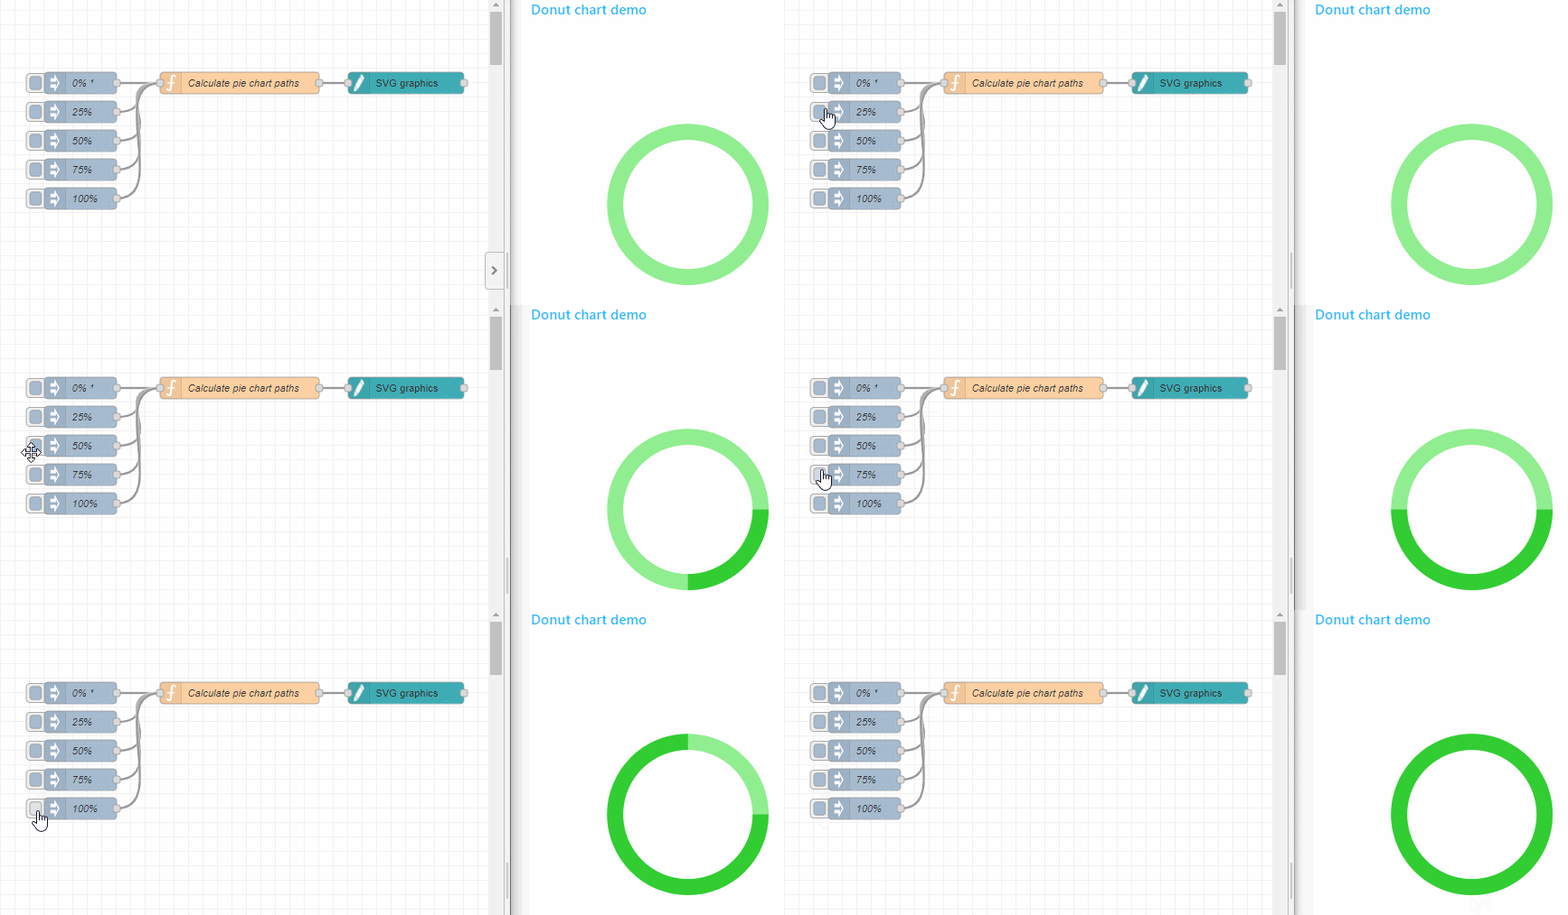
Here is the update pie chart flow, to draw a donut chart:

[{"id":"cefc97a537a9df53","type":"ui_svg_graphics","z":"c53e793dd2f3be09","group":"6293cddec4b65c5f","order":1,"width":"9","height":"9","svgString":"<svg x=\"0\" y=\"0\" height=\"100%\" viewBox=\"0 0 200 200\" width=\"100%\" xmlns=\"http://www.w3.org/2000/svg\" xmlns:svg=\"http://www.w3.org/2000/svg\" xmlns:xlink=\"http://www.w3.org/1999/xlink\">\n  <!-- Pie chart (consisting out of a full circle and a circle segment on top of it -->\n  <path id=\"donut_full_circle\" style=\"fill:lightgreen\" />\n  <path id=\"donut_segment\" style=\"fill:limegreen\" />\n  <path id=\"donut_inner_circle\" style=\"fill:white\" />\n</svg>","clickableShapes":[],"javascriptHandlers":[],"smilAnimations":[],"bindings":[],"showCoordinates":false,"autoFormatAfterEdit":false,"showBrowserErrors":true,"showBrowserEvents":false,"enableJsDebugging":false,"sendMsgWhenLoaded":false,"noClickWhenDblClick":false,"outputField":"payload","editorUrl":"//drawsvg.org/drawsvg.html","directory":"","panning":"disabled","zooming":"disabled","panOnlyWhenZoomed":false,"doubleClickZoomEnabled":false,"mouseWheelZoomEnabled":false,"dblClickZoomPercentage":150,"cssString":"div.ui-svg svg{\n    color: var(--nr-dashboard-widgetColor);\n    fill: currentColor !important;\n}\ndiv.ui-svg path {\n    fill: inherit;\n}","name":"","x":820,"y":120,"wires":[[]]},{"id":"96d685d613bae445","type":"function","z":"c53e793dd2f3be09","name":"Calculate pie chart paths","func":"// Define the center and radius\nconst centerX = 100;\nconst centerY = 100;\nconst radius = 50;\nconst donutWidth = 10;\n\n// Full Circle\nconst fullCirclePath = `M ${centerX - radius}, ${centerY} \n          A ${radius}, ${radius} 0 1, 0 ${centerX + radius}, ${centerY} \n          A ${radius}, ${radius} 0 1, 0 ${centerX - radius}, ${centerY} Z`\n\n// Inner Circle\nconst innerRadius = radius - donutWidth;\nconst innerCirclePath = `M ${centerX - innerRadius}, ${centerY} \n          A ${innerRadius}, ${innerRadius} 0 1, 0 ${centerX + innerRadius}, ${centerY} \n          A ${innerRadius}, ${innerRadius} 0 1, 0 ${centerX - innerRadius}, ${centerY} Z`\n\n// Segment\nconst segmentStartAngle = 0; // Specify the start angle for the segment\n\nlet segmentPercentage = msg.payload;\n\n// Calculate the segment stop angle based on the percentage from the input messag\nlet segmentStopAngle;\nif (segmentPercentage === 100) {\n  // Handle the case when the percentage is 100%\n  segmentStopAngle = 359.99; // Set it to 360 degrees for a full circle\n} else {\n  segmentStopAngle = (segmentPercentage / 100) * 360;\n}\n\n// Convert angles to radians\nconst segmentStartAngleRad = (segmentStartAngle * Math.PI) / 180;\nconst segmentStopAngleRad = (segmentStopAngle * Math.PI) / 180;\n\n// Calculate the start and end points of the segment arc\nconst segmentStartX = centerX + radius * Math.cos(segmentStartAngleRad);\nconst segmentStartY = centerY + radius * Math.sin(segmentStartAngleRad);\nconst segmentEndX = centerX + radius * Math.cos(segmentStopAngleRad);\nconst segmentEndY = centerY + radius * Math.sin(segmentStopAngleRad);\n\n// Determine the large-arc-flag and sweep-flag for the segment\nconst segmentLargeArcFlag = segmentStopAngle - segmentStartAngle > 180 ? 1 : 0;\nconst segmentSweepFlag = 1;\n\n// Create the path data for the segment\nconst segmentPath = `M ${segmentStartX},${segmentStartY} A ${radius},${radius} 0 ${segmentLargeArcFlag},${segmentSweepFlag} ${segmentEndX},${segmentEndY} L ${centerX},${centerY} Z`;\n\nmsg.payload = [{\n    \"command\": \"set_attribute\",\n    \"selector\": \"#donut_full_circle\",\n    \"attributeName\": \"d\",\n    \"attributeValue\": fullCirclePath\n },\n {\n    \"command\": \"set_attribute\",\n    \"selector\": \"#donut_segment\",\n    \"attributeName\": \"d\",\n    \"attributeValue\": segmentPath\n },\n {\n    \"command\": \"set_attribute\",\n    \"selector\": \"#donut_inner_circle\",\n    \"attributeName\": \"d\",\n    \"attributeValue\": innerCirclePath\n }]\n\nreturn msg;","outputs":1,"timeout":0,"noerr":0,"initialize":"","finalize":"","libs":[],"x":590,"y":120,"wires":[["cefc97a537a9df53"]]},{"id":"019aeda8ccb43e5a","type":"inject","z":"c53e793dd2f3be09","name":"0%","props":[{"p":"payload"}],"repeat":"","crontab":"","once":true,"onceDelay":0.1,"topic":"","payload":"0","payloadType":"num","x":370,"y":120,"wires":[["96d685d613bae445"]]},{"id":"1133f18615aefcad","type":"inject","z":"c53e793dd2f3be09","name":"25%","props":[{"p":"payload"}],"repeat":"","crontab":"","once":false,"onceDelay":0.1,"topic":"","payload":"25","payloadType":"num","x":370,"y":160,"wires":[["96d685d613bae445"]]},{"id":"e45cfc7c29d3bf30","type":"inject","z":"c53e793dd2f3be09","name":"50%","props":[{"p":"payload"}],"repeat":"","crontab":"","once":false,"onceDelay":0.1,"topic":"","payload":"50","payloadType":"num","x":370,"y":200,"wires":[["96d685d613bae445"]]},{"id":"5d1bb13331a00be0","type":"inject","z":"c53e793dd2f3be09","name":"75%","props":[{"p":"payload"}],"repeat":"","crontab":"","once":false,"onceDelay":0.1,"topic":"","payload":"75","payloadType":"num","x":370,"y":240,"wires":[["96d685d613bae445"]]},{"id":"93432edbf797e7ab","type":"inject","z":"c53e793dd2f3be09","name":"100%","props":[{"p":"payload"}],"repeat":"","crontab":"","once":false,"onceDelay":0.1,"topic":"","payload":"100","payloadType":"num","x":370,"y":280,"wires":[["96d685d613bae445"]]},{"id":"6293cddec4b65c5f","type":"ui_group","name":"Donut chart demo","tab":"db70d53e.369ce8","order":2,"disp":true,"width":"9","collapse":false,"className":""},{"id":"db70d53e.369ce8","type":"ui_tab","name":"Memory usage","icon":"dashboard","disabled":false,"hidden":false}]

Which looks like this:
donut chart

I need to think about the gauge...

1 Like

Wonderful, Bart. Thank you very much. I think that with some widgets of this type, we can create very good industrial synoptic tables using Node-Red. I'm currently working on a library of equipment types that already contain all the requirements for each of them. So your contribution will help a lot. And here's a suggestion for a node-contrib with svg indicators.

Best regards,

Roberto

I'd be interested to hear more about that. Something that I'm keen for us as a community to pursue is to make better use of web components. Custom web components can be engineered to work both in and out of Node-RED and could probably be engineered with extensions to support BOTH Dashboard 2 AND UIBUILDER. They would also work with simple http-in/-out nodes. Web components would work with both standard HTML and SVG.

1 Like

This topic was automatically closed 14 days after the last reply. New replies are no longer allowed.