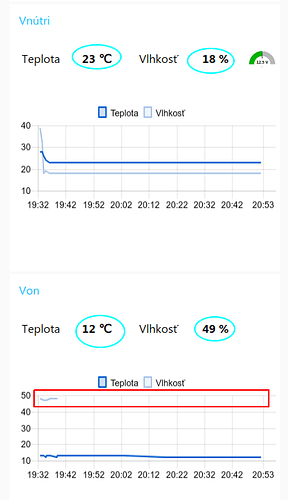
yes. sorry. i am a new here 
[{"id":"374fd6b.35dfb2a","type":"inject","z":"a2fdf036.27799","name":"","topic":"15min","payload":"","payloadType":"date","repeat":"900","crontab":"","once":false,"onceDelay":0.1,"x":150,"y":100,"wires":[["62d80001.18616","48a6e372.5b469c"]]},{"id":"62d80001.18616","type":"rpi-dht22","z":"a2fdf036.27799","name":"","topic":"rpi-dht11-in","dht":"11","pintype":"1","pin":"7","x":370,"y":100,"wires":[["2fbf1066.76b89"]]},{"id":"2fbf1066.76b89","type":"function","z":"a2fdf036.27799","name":"2 hodnoty do grafu IN","func":"var msg1 = {};\nvar msg2 = {};\n\nmsg1.payload = Number(msg.payload);\nmsg1.topic = \"Teplota\";\n\nmsg2.payload = Number(msg.humidity);\nmsg2.topic = \"Vlhkosť\";\n\nreturn [msg1, msg2];","outputs":2,"noerr":0,"x":620,"y":100,"wires":[["5e8f711f.0f798","f2d0187f.89e1a8"],["5e8f711f.0f798","f57d6f49.1e8f5"]]},{"id":"5e8f711f.0f798","type":"ui_chart","z":"a2fdf036.27799","name":"G1","group":"3f5da8d6.8b6948","order":3,"width":"0","height":"0","label":"","chartType":"line","legend":"true","xformat":"HH:mm","interpolate":"linear","nodata":"No data","dot":false,"ymin":"","ymax":"","removeOlder":1,"removeOlderPoints":"","removeOlderUnit":"86400","cutout":0,"useOneColor":false,"colors":["#0a62d0","#aec7e8","#f2ec44","#2ca02c","#98df8a","#8a1718","#ff9896","#9467bd","#c5b0d5"],"useOldStyle":true,"x":930,"y":100,"wires":[[],[]]},{"id":"f2d0187f.89e1a8","type":"ui_text","z":"a2fdf036.27799","group":"3f5da8d6.8b6948","order":1,"width":"3","height":"1","name":"","label":"Teplota","format":"{{msg.payload}} ℃","layout":"row-spread","x":940,"y":140,"wires":[]},{"id":"f57d6f49.1e8f5","type":"ui_text","z":"a2fdf036.27799","group":"3f5da8d6.8b6948","order":2,"width":"3","height":"1","name":"","label":"Vlhkosť","format":"{{msg.payload}} %","layout":"row-spread","x":940,"y":180,"wires":[]},{"id":"48a6e372.5b469c","type":"rpi-dht22","z":"a2fdf036.27799","name":"","topic":"rpi-dht11-in","dht":"11","pintype":"1","pin":"11","x":370,"y":240,"wires":[["d3bdb306.3416f"]]},{"id":"d3bdb306.3416f","type":"function","z":"a2fdf036.27799","name":"2 hodnoty do grafu IN","func":"var msg1 = {};\nvar msg2 = {};\n\nmsg1.payload = Number(msg.payload);\nmsg1.topic = \"Teplota\";\n\nmsg2.payload = Number(msg.humidity);\nmsg2.topic = \"Vlhkosť\";\n\nreturn [msg1, msg2];","outputs":2,"noerr":0,"x":620,"y":240,"wires":[["481c2b7e.bd76b4","632cc526.678ebc"],["481c2b7e.bd76b4","642a286f.31b0f8"]]},{"id":"481c2b7e.bd76b4","type":"ui_chart","z":"a2fdf036.27799","name":"G1","group":"3f5da8d6.8b6948","order":6,"width":"0","height":"0","label":"","chartType":"line","legend":"true","xformat":"HH:mm","interpolate":"linear","nodata":"No data","dot":false,"ymin":"","ymax":"","removeOlder":1,"removeOlderPoints":"","removeOlderUnit":"86400","cutout":0,"useOneColor":false,"colors":["#0a62d0","#aec7e8","#f2ec44","#2ca02c","#98df8a","#8a1718","#ff9896","#9467bd","#c5b0d5"],"useOldStyle":true,"x":930,"y":240,"wires":[[],[]]},{"id":"632cc526.678ebc","type":"ui_text","z":"a2fdf036.27799","group":"3f5da8d6.8b6948","order":4,"width":"3","height":"1","name":"","label":"Teplota","format":"{{msg.payload}} ℃","layout":"row-spread","x":940,"y":280,"wires":[]},{"id":"642a286f.31b0f8","type":"ui_text","z":"a2fdf036.27799","group":"3f5da8d6.8b6948","order":5,"width":"3","height":"1","name":"","label":"Vlhkosť","format":"{{msg.payload}} %","layout":"row-spread","x":940,"y":320,"wires":[]},{"id":"3f5da8d6.8b6948","type":"ui_group","z":"","name":"Default","tab":"d6d915a6.98c5e8","disp":true,"width":"6"},{"id":"d6d915a6.98c5e8","type":"ui_tab","z":"","name":"testing","icon":"dashboard","order":6}]


