I'm trying to graph data from a database, but the graphs come out square, I don't know what it will be

var d = ["["]
for (var i=0; i < msg.payload.length; i++)
{
d += '{ "x":' + msg.payload[i].thetime + ', "y":' + msg.payload[i].Bat1 + '}';
if (i < (msg.payload.length-1)){
    d += ","
    } else {
    d += "]"
    }
}
var a = JSON.parse(d)


var f = ["["]
for (var j=0; j < msg.payload.length; j++)
{
f += '{ "x":' + msg.payload[j].thetime + ', "y":' + msg.payload[j].Bat2 + '}';
if (j < (msg.payload.length-1)){
    f += ","
    } else {
    f += "]"
    }
}
var b = JSON.parse(f)

var x = ["["]
for (var m=0; m < msg.payload.length; m++)
{
x += '{ "x":' + msg.payload[m].thetime + ', "y":' + msg.payload[m].Bat3 + '}';
if (m < (msg.payload.length-1)){
    x += ","
    } else {
    x += "]"
    }
}
var c = JSON.parse(x)

msg.payload = [{
"series" : ["Bat1","Bat2","Bat3"],
"data" : [a,b,c],
"labels" : [""]
}]

return msg;
The dashboard line chart has various interpolation options. Maybe you want "Bezier".
I already tried it, but I need all the lines to be like Bat1 and not in ladder
Please post a sample of your data, a minutes worth maybe.
var sqliteTimeStamp = Date.now()
var Bat1 = msg.payload.Bat1;
var Bat2 = msg.payload.Bat2;
var Bat3 = msg.payload.Bat3;


msg.topic = `insert into Battery(thetime, Bat1, Bat2, Bat3) values ('${sqliteTimeStamp}', '${Bat1}', '${Bat2}', '${Bat3}')`
return msg;
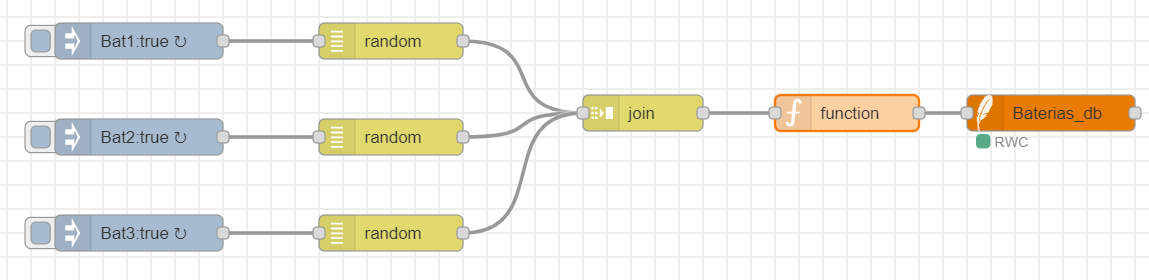
I am inserting data every 10s to a sqlite table
Your join node, whenever it is triggered, will send the most recent values received on all three inputs. If it is set up wrongly that will result in repeated values in the database.
I suggest you check that it's set to send data when 3 messages are received.
Also use just one inject node to trigger all three random number generators.
Yes, you are right, the problem is the data, thanks!!!