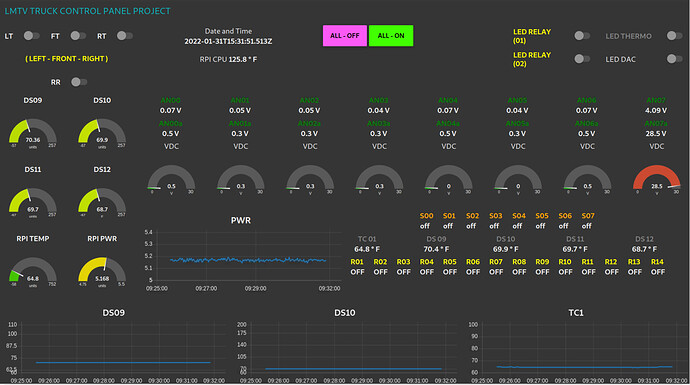
Thanks for your assistance. I am measuring the voltage directly at the battery terminals and connect them in series to achieve 3 voltage points for testing. Don't have a bench power supply. I read the voltage from the DAQCplate Pi-Plate. At 9.4 volts (measured at the battery) the voltage divider is used to adjust the Dashboard reading to 9.4 volts. As the voltage increases to 18.7 and 28.2 the Dashboard readings through the Pi-Plate drifts. Can you explain how the battery internal resistance would cause non-linear response. I am very new to electronics, learning electronics and programming is my retirement project.
Rather that working around whatever the problem is you should identify why your measurement is not linear.
What does 0 volts give?
Also which pi plate are you using?
Finally, what do you see if you put the voltmeter on the input to the pi plate?
[Edit] I see you have said it is a DAQCplate. The spec seems to say those are 0-4 volts, so you shouldn't go more than that, which will explain part of the non-linearity, so fix that first. However I can't immediately see the input impedance of the analogue inputs, so you need to find out what that is, to make sure that 100k is still not too big.
If you must go down this avenue, read up on "curve fitting"
Here is a quick demo i knocked up using regression-js
Example...
const regression = require('regression');
const samples = [[9.4,9.4],[18.7, 18.9], [28.2, 24.6]];
let result;

result = regression.logarithmic(samples);
// console.log(result)
console.log("logarithmic...")
console.log("predict 1", result.predict(1) ) //       >>  predict 1 [ 1, -21.59 ]
console.log("predict 9", result.predict(9) ) //       >>  predict 9 [ 9, 8.8 ]
console.log("predict 9.4", result.predict(9.4) ) //   >>  predict 9.4 [ 9.4, 9.4 ]
console.log("predict 10", result.predict(10) ) //     >>  predict 10 [ 10, 10.25 ]
console.log("predict 18", result.predict(18) ) //     >>  predict 18 [ 18, 18.38 ]
console.log("predict 18.7", result.predict(18.7) ) // >>  predict 18.7 [ 18.7, 18.91 ]
console.log("predict 19", result.predict(19) ) //     >>  predict 19 [ 19, 19.13 ]
console.log("predict 28", result.predict(28) ) //     >>  predict 28 [ 28, 24.49 ]
console.log("predict 28.2", result.predict(28.2) ) // >>  predict 28.2 [ 28.2, 24.59 ]
console.log("predict 29", result.predict(29) ) //     >>  predict 29 [ 29, 24.98 ]
You can play with it live here: fit_curve_regression - Replit
NOTE
More samples across the full range will make your results more realistic.
The problem with that is that if the problem is that the input impedance of the ADC is not large compared to the pot then that impedance may well vary with temperature, so @HS10 could configure the curve to compensate, but the calibration would drift with temperature. Also he would most likely need a different curve for every input.
The correct solution is to understand and fix whatever is making it non-linear.
100% agree Colin. Precisely why I prefaced it with "If you must go down this avenue"
And the voltage also change with temperature changes
Hi Folks, Thanks
Here is zero voltage AN00 – AN06 from the dashboard, no power connected to these.
AN07 has voltage applied reading 28.5 on the dashboard, with a measured voltage of 27.7 volts at the source.
The voltage measured at the DAQCplate is ~ 4.7 volts on AN07a.
Yes, I would like to better understand the electronics aspect.
FYI – This is my first Raspberry PI project. I am very much a novice.
The goal is to monitor and control various systems on this truck.
The current dashboard is for development and testing. The final dashboard will be primarily gauges, controls, and alarms.
One control function example: if the pneumatic mast/solar panels are raised or not properly secured a relay will inhibit the ability to start the engine (with alarm).
Very much appreciate your assistance.
That looks like a bit of a beast 
I didn't mean open circuit, I meant 0v applied to the input. That should give you 0 out of the ADC. If it doesn't then something is not right.
Do you mean that you are seeing 4.7V on the ADC input? As I said, the spec sheet I found said that the max input is 4V or thereabouts, so you must not apply more than that and expect a good reading. Unless you have a different spec sheet.
How are you scaling the ADC output in the pi?
Hi Colin
My goal is to keep the ADC ~ 3 volts with 30 volts input. The voltage is higher when attempting at align at 30 volts.
How would I introduce zero volts? Would this a short circuit across the voltage divider input?
I am attempting to use the range node to scale, which is linear.
Thanks

yes - 0V input = short the ADC input to ground - should give 0V reading. Personally I would then input the known max (30V?) from a bench PSU and calibrate the range node from there. There must be something really odd going on for it not to be linear between those points... though I must admit when i was doing something similar on vehicles we used a dedicated battery management system that just gave us data via serial - as it had all the capacity curves and temperature compensation built in so things like run-time calculations were easy  - and also as the main battery signal was very noisy !
Great experiment, shorting the input (tried several of them) the dashboard display reads the same (unchanged).
I suggest that you start by feeding the raw value from the ADC straight to the gauge to see what values you are actually getting. Measure the voltage at the ADC input and see what you get out on the gauge. You can adjust the pot to get a range of input values to test.
This topic was automatically closed 60 days after the last reply. New replies are no longer allowed.


