hi there,
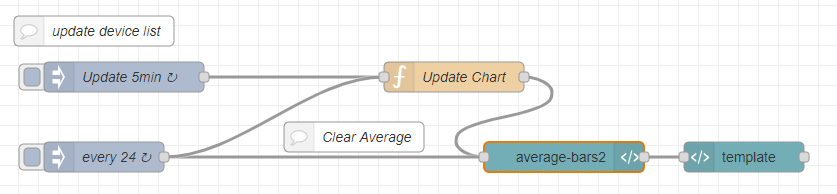
I have adapted a flow for the dynamic visualization of zigbee battery device status. So far so good. However I have a strange phenomenon with varying bar width and y-offset - see attached screenshot:

The bars are "added" over time as new zigbee devices report on the network. However, I still have a hard time to understand, if the width or off-set variations can be caused by something I did, or if it is an issue with the "average-bars" node?
Here the flow:
[
    {
        "id": "58348f97.92d9b",
        "type": "ui_template",
        "z": "c4134334.87229",
        "group": "ac1288ed.b27d68",
        "name": "",
        "order": 1,
        "width": 20,
        "height": 8,
        "format": "<div ng-bind-html=\"msg.payload\"></div>",
        "storeOutMessages": true,
        "fwdInMessages": true,
        "templateScope": "local",
        "x": 765,
        "y": 531,
        "wires": [
            []
        ]
    },
    {
        "id": "9061465f.df66f8",
        "type": "average-bars",
        "z": "c4134334.87229",
        "name": "average-bars2",
        "title": "Battery %",
        "period": "topic",
        "yMin": "0",
        "yMax": "100",
        "showBarsValue": true,
        "showScaleValue": true,
        "showLastValue": false,
        "showAverageValue": false,
        "showMinimumValue": false,
        "showMaximumValue": false,
        "maxBar": "50",
        "topColor": "#1afa0a",
        "bottomColor": "#df3d20",
        "unit": "%",
        "fontColor": "#ffffff",
        "barStyle": "Equalizer",
        "decimal": "0",
        "x": 585,
        "y": 531,
        "wires": [
            [
                "58348f97.92d9b"
            ]
        ]
    },
    {
        "id": "256057db.4693d8",
        "type": "function",
        "z": "c4134334.87229",
        "name": "Update Chart",
        "func": "var data = flow.get(\"zigbeeBattery\");\n\narr = [];\n\nvar count =  data.length;\n    for ( i=0; i < count; i++){\n        var nmsg = {payload:data[i].info.battery, topic:data[i].info.name};\n        arr.push(nmsg);\n    }\n\nreturn [arr];",
        "outputs": 1,
        "noerr": 0,
        "initialize": "",
        "finalize": "",
        "x": 475,
        "y": 451,
        "wires": [
            [
                "9061465f.df66f8"
            ]
        ]
    },
    {
        "id": "c1f85a56.feea38",
        "type": "inject",
        "z": "c4134334.87229",
        "name": "Update 5min",
        "props": [
            {
                "p": "payload",
                "v": "",
                "vt": "date"
            },
            {
                "p": "topic",
                "v": "",
                "vt": "string"
            }
        ],
        "repeat": "300",
        "crontab": "",
        "once": false,
        "onceDelay": 0.1,
        "topic": "",
        "payload": "",
        "payloadType": "date",
        "x": 145,
        "y": 451,
        "wires": [
            [
                "256057db.4693d8"
            ]
        ]
    },
    {
        "id": "663c34e0.2f209c",
        "type": "inject",
        "z": "c4134334.87229",
        "name": "every 24",
        "props": [
            {
                "p": "payload",
                "v": "clear",
                "vt": "str"
            },
            {
                "p": "topic",
                "v": "",
                "vt": "string"
            }
        ],
        "repeat": "",
        "crontab": "00 12 * * *",
        "once": false,
        "onceDelay": 0.1,
        "topic": "",
        "payload": "clear",
        "payloadType": "str",
        "x": 125,
        "y": 531,
        "wires": [
            [
                "9061465f.df66f8",
                "256057db.4693d8"
            ]
        ]
    },
    {
        "id": "5686a190.1d811",
        "type": "comment",
        "z": "c4134334.87229",
        "name": "update device list",
        "info": "",
        "x": 115,
        "y": 405,
        "wires": []
    },
    {
        "id": "b7724ed9.e27e7",
        "type": "comment",
        "z": "c4134334.87229",
        "name": "Clear Average",
        "info": "",
        "x": 375,
        "y": 511,
        "wires": []
    },
    {
        "id": "ac1288ed.b27d68",
        "type": "ui_group",
        "name": "Zigbee Battery Status",
        "tab": "8670da6a.136438",
        "order": 1,
        "disp": true,
        "width": "20",
        "collapse": false
    },
    {
        "id": "8670da6a.136438",
        "type": "ui_tab",
        "name": "SYS - Zigbee Battery",
        "icon": "dashboard",
        "order": 35,
        "disabled": false,
        "hidden": false
    }
]
Any thoughts?
Thanks,