hi i'm trying to make a chart for highest and lowest temperatures outside from an mqtt sensor. but am failing miserably, any sugestions where im going wrong would be great thanks
martin
[
{
"id": "558a976d1540e55c",
"type": "group",
"z": "d3637ed3c66aa0d7",
"style": {
"stroke": "#999999",
"stroke-opacity": "1",
"fill": "none",
"fill-opacity": "1",
"label": true,
"label-position": "nw",
"color": "#a4a4a4"
},
"nodes": [
"e1cc8e5dcfa599e4",
"8dc4a744a869b740",
"6a492259f74bde19",
"9e7148d9a5fcbfae",
"b6ed25afa97b9f26",
"5ae30d57abb32fac",
"5269df838f656cd0"
],
"x": 14,
"y": 159,
"w": 692,
"h": 162
},
{
"id": "e1cc8e5dcfa599e4",
"type": "mqtt in",
"z": "d3637ed3c66aa0d7",
"g": "558a976d1540e55c",
"name": "outside",
"topic": "zone0/text",
"qos": "2",
"datatype": "auto-detect",
"broker": "dc0340c9643bd396",
"nl": false,
"rap": true,
"rh": 0,
"inputs": 0,
"x": 90,
"y": 240,
"wires": [
[
"5269df838f656cd0",
"5ae30d57abb32fac"
]
]
},
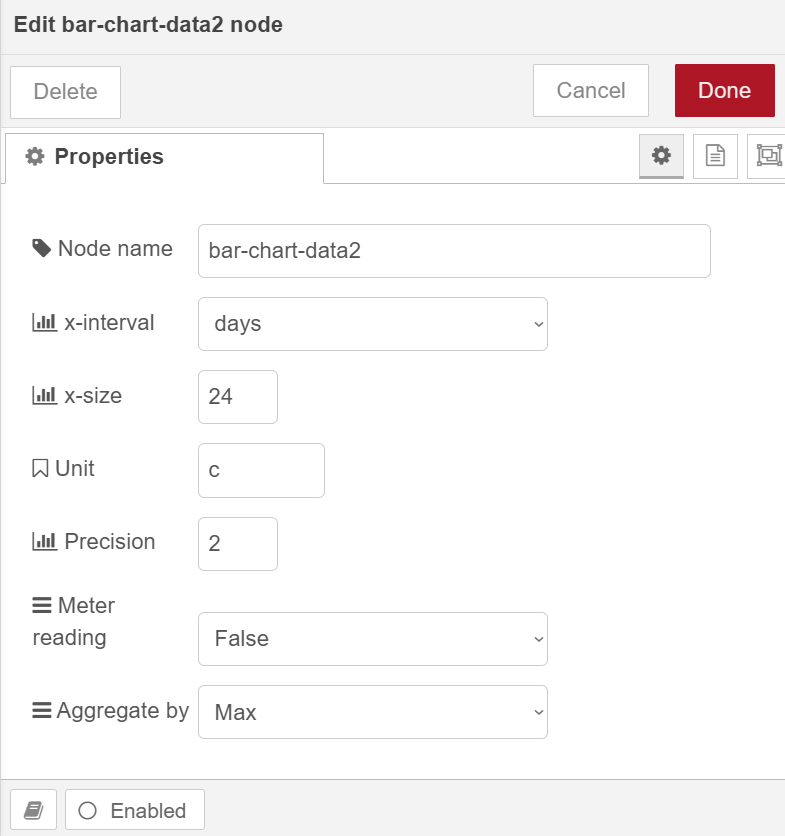
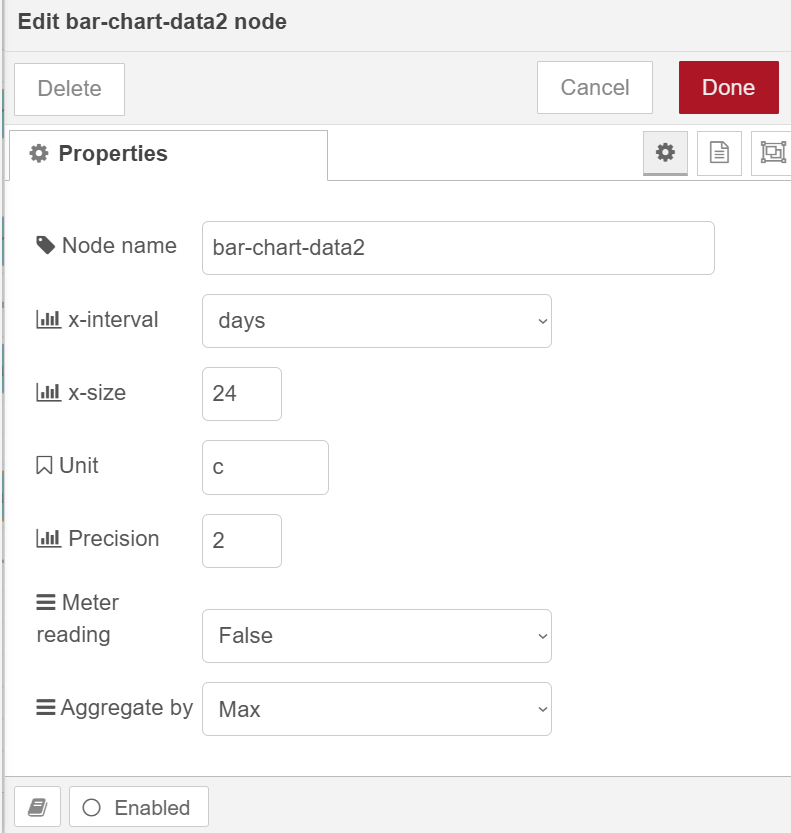
{
"id": "8dc4a744a869b740",
"type": "bar-chart-data2",
"z": "d3637ed3c66aa0d7",
"g": "558a976d1540e55c",
"name": "bar-chart-data2",
"x_interval": "days",
"x_size": 24,
"unit": "c",
"precision": 2,
"is_meter_reading": "False",
"agg_by": "max",
"x": 420,
"y": 200,
"wires": [
[
"6a492259f74bde19"
]
]
},
{
"id": "6a492259f74bde19",
"type": "ui_chart",
"z": "d3637ed3c66aa0d7",
"g": "558a976d1540e55c",
"name": "",
"group": "b5f7f90a2f77ea3d",
"order": 4,
"width": 18,
"height": 5,
"label": "lowest outside",
"chartType": "bar",
"legend": "true",
"xformat": "HH:mm:ss",
"interpolate": "linear",
"nodata": "",
"dot": false,
"ymin": "",
"ymax": "",
"removeOlder": 1,
"removeOlderPoints": "",
"removeOlderUnit": "3600",
"cutout": 0,
"useOneColor": false,
"useUTC": false,
"colors": [
"#1f77b4",
"#aec7e8",
"#ff7f0e",
"#2ca02c",
"#98df8a",
"#d62728",
"#ff9896",
"#9467bd",
"#c5b0d5"
],
"outputs": 1,
"useDifferentColor": false,
"className": "",
"x": 600,
"y": 200,
"wires": [
[]
]
},
{
"id": "9e7148d9a5fcbfae",
"type": "bar-chart-data2",
"z": "d3637ed3c66aa0d7",
"g": "558a976d1540e55c",
"name": "bar-chart-data2",
"x_interval": "days",
"x_size": 24,
"unit": "c",
"precision": 2,
"is_meter_reading": "False",
"agg_by": "max",
"x": 420,
"y": 280,
"wires": [
[
"b6ed25afa97b9f26"
]
]
},
{
"id": "b6ed25afa97b9f26",
"type": "ui_chart",
"z": "d3637ed3c66aa0d7",
"g": "558a976d1540e55c",
"name": "",
"group": "b5f7f90a2f77ea3d",
"order": 3,
"width": 18,
"height": 5,
"label": "highest outside",
"chartType": "bar",
"legend": "true",
"xformat": "HH:mm:ss",
"interpolate": "linear",
"nodata": "",
"dot": false,
"ymin": "",
"ymax": "",
"removeOlder": 1,
"removeOlderPoints": "",
"removeOlderUnit": "3600",
"cutout": 0,
"useOneColor": false,
"useUTC": false,
"colors": [
"#1f77b4",
"#aec7e8",
"#ff7f0e",
"#2ca02c",
"#98df8a",
"#d62728",
"#ff9896",
"#9467bd",
"#c5b0d5"
],
"outputs": 1,
"useDifferentColor": false,
"className": "",
"x": 600,
"y": 280,
"wires": [
[]
]
},
{
"id": "5ae30d57abb32fac",
"type": "smooth",
"z": "d3637ed3c66aa0d7",
"g": "558a976d1540e55c",
"name": "lowest",
"property": "payload",
"action": "min",
"count": "10",
"round": "",
"mult": "single",
"reduce": true,
"x": 270,
"y": 200,
"wires": [
[
"8dc4a744a869b740"
]
]
},
{
"id": "5269df838f656cd0",
"type": "smooth",
"z": "d3637ed3c66aa0d7",
"g": "558a976d1540e55c",
"name": "highest",
"property": "payload",
"action": "max",
"count": "10",
"round": "",
"mult": "single",
"reduce": true,
"x": 260,
"y": 280,
"wires": [
[
"9e7148d9a5fcbfae"
]
]
},
{
"id": "dc0340c9643bd396",
"type": "mqtt-broker",
"name": "",
"broker": "192.168.0.107",
"port": "1883",
"clientid": "",
"autoConnect": true,
"usetls": false,
"protocolVersion": "4",
"keepalive": "60",
"cleansession": true,
"autoUnsubscribe": true,
"birthTopic": "",
"birthQos": "0",
"birthPayload": "",
"birthMsg": {},
"closeTopic": "",
"closeQos": "0",
"closePayload": "",
"closeMsg": {},
"willTopic": "",
"willQos": "0",
"willPayload": "",
"willMsg": {},
"userProps": "",
"sessionExpiry": ""
},
{
"id": "b5f7f90a2f77ea3d",
"type": "ui_group",
"name": "Group 1",
"tab": "eaa84631f407bcd4",
"order": 1,
"disp": true,
"width": "18",
"collapse": false,
"className": ""
},
{
"id": "eaa84631f407bcd4",
"type": "ui_tab",
"name": "daily temperatures",
"icon": "dashboard",
"order": 5,
"disabled": false,
"hidden": false
},
{
"id": "5ef6f7ccfc351005",
"type": "global-config",
"env": [],
"modules": {
"node-red-contrib-dashboard-bar-chart-data2": "0.9.101",
"node-red-dashboard": "3.6.6",
"node-red-node-smooth": "0.1.2"
}
}
]