Using Prometheus out node for multiple values

Hi folks,

I have sensor data from an ESP32 being sent to node-red through an MQTT broker.
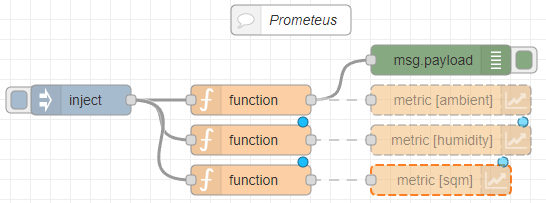
Out of the 38 values been sent from the ESP32, 6 of them will require to be sent to the Prometheus interface and then eventually to Grafana. I have successfully sent one value ("ambient") to Prometheus using the 'Prometheus out node' with the function node below. Is there a way to include additional values in this function, or should I create a function for each value that seems to be a tedious job?
Below is the complete object list of values from the ESP32.

msg.payload = {
    "op": "set",
    "val": parseInt(msg.payload.ambient),
    "Labels": {
    "tag_1": "Ambient",
}
}
return msg;

{"controllertype":"mySQM+","firmware":127,"uptime":"03:15:52","date":"01/01/1900","time":"00:00:00","sqm":17.25,"nelm":3.32,"lux":0.0136,"ambient":23.74,"humidity":44.2,"dewpoint":10.85,"pressure":1011.4,"slpressure":1012.24,"bme280alt":7,"skyambient":20,"skyobject":20,"skystate":1,"cloudcover":100,"raining":0,"rvout":0,"rainprevhr":0,"raincurrhr":0,"raincurrday":0,"windspd":0,"windavg":0,"windgust":0,"windchill":100,"beaufort":0,"winddir":0,"gpsdate":"01/01/1900","gpstime":"00:00:00","gpslat":"-77 00 00 S","gpslon":"166 00 00 E","gpsalt":0,"gpssat":0,"gpsfix":0,"mac":"78:E3:6D:0A:24:14","makehay":16.37}

Thanks in advance for any help.

Do you mean the prometheus-exporter node from node-red-contrib-prometheus-exporter? It is always a good idea to say exactly which node you have installed when asking about contrib nodes.

Assuming it is that then I don't see anything in the node's help readme that says you can do more than one at a time, however you can do it all in a single function by creating an array containing all the metrics and then sending multiple messages. Something like

const metrics = [
    {
        "op": "set",
        "val": parseInt(msg.payload.ambient),
        "Labels": {
            "tag_1": "Ambient",
        }
    },
    {
        "op": "set",
        "val": parseInt(msg.payload.another_value),
        "Labels": {
            "tag_1": "Another value",
        }
    },
]
metrics.forEach(sendIt)
return null;

function sendIt(metric) {
    node.send({payload: metric})
}

Obviously you need to add the correct metrics at the start.

Hi @Colin,

Thanks for the prompt reply.
Indeed, I was referring to the Prometheus-exporter node.
I have changed the function like you suggested, however, the http://locahost:1880/metrics is only creating metrics for the "humidity" value and not the "ambient" value as can be seen below.

Screenshot 2022-03-24 184442

The test flow I'm using is this:

[{"id":"6036fa3e58c9f358","type":"tab","label":"Flow 1","disabled":false,"info":"","env":[]},{"id":"61f5e7e4038dc507","type":"debug","z":"6036fa3e58c9f358","name":"","active":true,"tosidebar":true,"console":false,"tostatus":false,"complete":"false","statusVal":"","statusType":"auto","x":490,"y":400,"wires":[]},{"id":"b76631f32a265a0b","type":"comment","z":"6036fa3e58c9f358","name":"Prometeus","info":"","x":340,"y":360,"wires":[]},{"id":"0fe0d20435678b5e","type":"function","z":"6036fa3e58c9f358","name":"","func":"const metrics = [\n    {\n        \"op\": \"set\",\n        \"val\": msg.payload.ambient,\n        \"Labels\": {\n            \"tag_1\": \"Ambient\",\n        }\n    },\n    {\n        \"op\": \"set\",\n        \"val\": msg.payload.humidity,\n        \"Labels\": {\n            \"tag_1\": \"humidity\",\n        }\n    },\n]\nmetrics.forEach(sendIt)\nreturn null;\n\nfunction sendIt(metric) {\n    node.send({payload: metric})\n}","outputs":1,"noerr":0,"initialize":"","finalize":"","libs":[],"x":300,"y":440,"wires":[["61f5e7e4038dc507","a533cfd74b95eea9"]]},{"id":"95a44c2bf4eca244","type":"inject","z":"6036fa3e58c9f358","name":"","props":[{"p":"payload"}],"repeat":"","crontab":"","once":false,"onceDelay":0.1,"topic":"","payload":"{\"controllertype\":\"mySQM+\",\"firmware\":127,\"uptime\":\"05:13:54\",\"date\":\"01/01/1900\",\"time\":\"00:00:00\",\"sqm\":15.1,\"nelm\":1.34,\"lux\":0.0985,\"ambient\":25.17,\"humidity\":51.3,\"dewpoint\":14.4,\"pressure\":1010.97,\"slpressure\":1011.81,\"bme280alt\":7,\"skyambient\":20,\"skyobject\":20,\"skystate\":1,\"cloudcover\":100,\"raining\":0,\"rvout\":0,\"rainprevhr\":0,\"raincurrhr\":0,\"raincurrday\":0,\"windspd\":0,\"windavg\":0,\"windgust\":0,\"windchill\":100,\"beaufort\":0,\"winddir\":0,\"gpsdate\":\"01/01/1900\",\"gpstime\":\"00:00:00\",\"gpslat\":\"-77 00 00 S\",\"gpslon\":\"166 00 00 E\",\"gpsalt\":0,\"gpssat\":0,\"gpsfix\":0,\"mac\":\"78:E3:6D:0A:24:14\",\"makehay\":15.59}","payloadType":"json","x":130,"y":440,"wires":[["0fe0d20435678b5e"]]},{"id":"a533cfd74b95eea9","type":"prometheus-exporter","z":"6036fa3e58c9f358","name":"","metric":"614f88afda896b44","x":500,"y":440,"wires":[]},{"id":"614f88afda896b44","type":"prometheus-metric-config","name":"ambient","help":"Ambient temperature","labels":"","mtype":"gauge"}]

Can't look at your flow at the moment as on my phone. What do you see in a debug node showing what is going to the Prometheus node?

@Colin
Here's the debug node when sending the function. The flow is also displayed.

I could probably create for each metric a separate function including a Prometheus node, something like the flow below, but it seems a tedious job if there are multiple sensor readings.

image

Any other ideas on this topic? Thanks.

Looking at the docs for the node it seems to be saying that you have to define the metric in the node before you can use it, and looking at the node setup it appears that the node can only have one metric, so perhaps you have to have a separate prometheus node for each metric. I suggest you ask on the node's github page how this should be done.

Did you get anywhere with this? I'm trying to do pretty much the same thing but I'm stuck with the same issue.

@astrojav

I'm now using this and it works great, shame it needs to be done in an additional docker container

Here's what I did.
I've created a function node for each data and a metric with the Prometheus-exporter node (out node).
The code in the function looks something like this:

msg.payload = {
  "op": "set",
  "val": msg.payload.ambient,
  "Labels": {
  "tag_1": "Ambient"
}
}
return msg;

Once the prometeus-exporter is creating the metrics you can view them by opening up a browser and accessing the /metrics endpoint of the NodeRED server. For example, for me I just type http://192.168.0.25:1880/metrics.

Here's a screenshot of the flow:
image

Two remarks, if I may.
Yes, the node-red-contrib-prometheus can't have variable for the name of the metric. It means that you have to create manually one configuration per parameter (metric) you want to use.

So, reusing this example, I would do this:

And then, to use it, instead of using the function node, you can do it with the change node and jsonata:

So, the tag represent the room used. It is interesting if you have more that one room with sensors, of course.

[
    {
        "id": "efe0964e4ba44407",
        "type": "prometheus-exporter",
        "z": "3af82246.3634ae",
        "name": "Humidity",
        "metric": "3ca20af8a00e4653",
        "x": 560,
        "y": 520,
        "wires": []
    },
    {
        "id": "06bea21d9e20448f",
        "type": "change",
        "z": "3af82246.3634ae",
        "name": "Humidity",
        "rules": [
            {
                "t": "set",
                "p": "payload",
                "pt": "msg",
                "to": "{\t   \"op\":\"set\",\t   \"labels\":{\"room\": payload.room},\t   \"val\": payload.humidity\t}",
                "tot": "jsonata"
            }
        ],
        "action": "",
        "property": "",
        "from": "",
        "to": "",
        "reg": false,
        "x": 360,
        "y": 520,
        "wires": [
            [
                "efe0964e4ba44407"
            ]
        ]
    },
    {
        "id": "4a84eadabd05f184",
        "type": "inject",
        "z": "3af82246.3634ae",
        "name": "",
        "props": [
            {
                "p": "payload"
            },
            {
                "p": "topic",
                "vt": "str"
            }
        ],
        "repeat": "",
        "crontab": "",
        "once": false,
        "onceDelay": 0.1,
        "topic": "",
        "payload": "{\"room\":\"kitchen\",\"humidity\":55}",
        "payloadType": "json",
        "x": 150,
        "y": 520,
        "wires": [
            [
                "06bea21d9e20448f"
            ]
        ]
    },
    {
        "id": "3ca20af8a00e4653",
        "type": "prometheus-metric-config",
        "name": "sensor_humidity",
        "help": "Value of humidity",
        "labels": "room",
        "mtype": "gauge"
    }
]

This topic was automatically closed 60 days after the last reply. New replies are no longer allowed.