I try to display data published from the MQTT server on the standard chart of the dashboard, but the number of data displayed is limited to a range much smaller than the time or number of points specified on the char node edit panel.
For instance, I set 24 hours or 1440 points to the panel, but only about 3 hours and 180 points are displayed. The data should have been published for at least 10 hours and over 600 points.
How can I display the data in the range specified in the edit panel?
Thank you very much for your support.
Yes, some old data on the left hand side of the chart disappear but I think I didn’t restart Node-RED such eraly morning.
In addition, some new data which I confirmed in the debug list also are not shown in the right hand side of the chart, neither. (Only data until around 30minutes ago are shown.)
Even after I set a very large number at the data points column, nothing changes.
I meant that, over a few minutes, does old data disappear as new data is added?
Show us another screenshot of the screen now.
I didn't suggest that you restarted node red, I suggested node-red restarted. That could be because node red crashed, or the computer rebooted for example.
It would not change immediately, once data has been dropped off the front then you would have to wait for new data to come in.
Is that screen shot supposed to show that? I see that the gauges appear to agree with the latest data shown on the chart. What time was it when you did that screenshot?
As suggested above, do another screenshot and tell us what time it is for you now.
It's not a problem with the chart specifically. The value shown on the pressure gauge agrees with the last value on the chart, suggesting that you have not sent data to either since 20:11.
How do you trigger pushing new data to the dashboard?
Can you show us your flow?
Also check that the clock is set correctly on both the machine running the browser and the machine running node-red. They may be the same machine of course.
Connect a debug node to show the value going to the chart and watch it. When a new value appears check the value it is showing and see if it agrees with the chart and the gauge. Also look at the time shown against the debug message.
Thank you very much for your continuous supports.
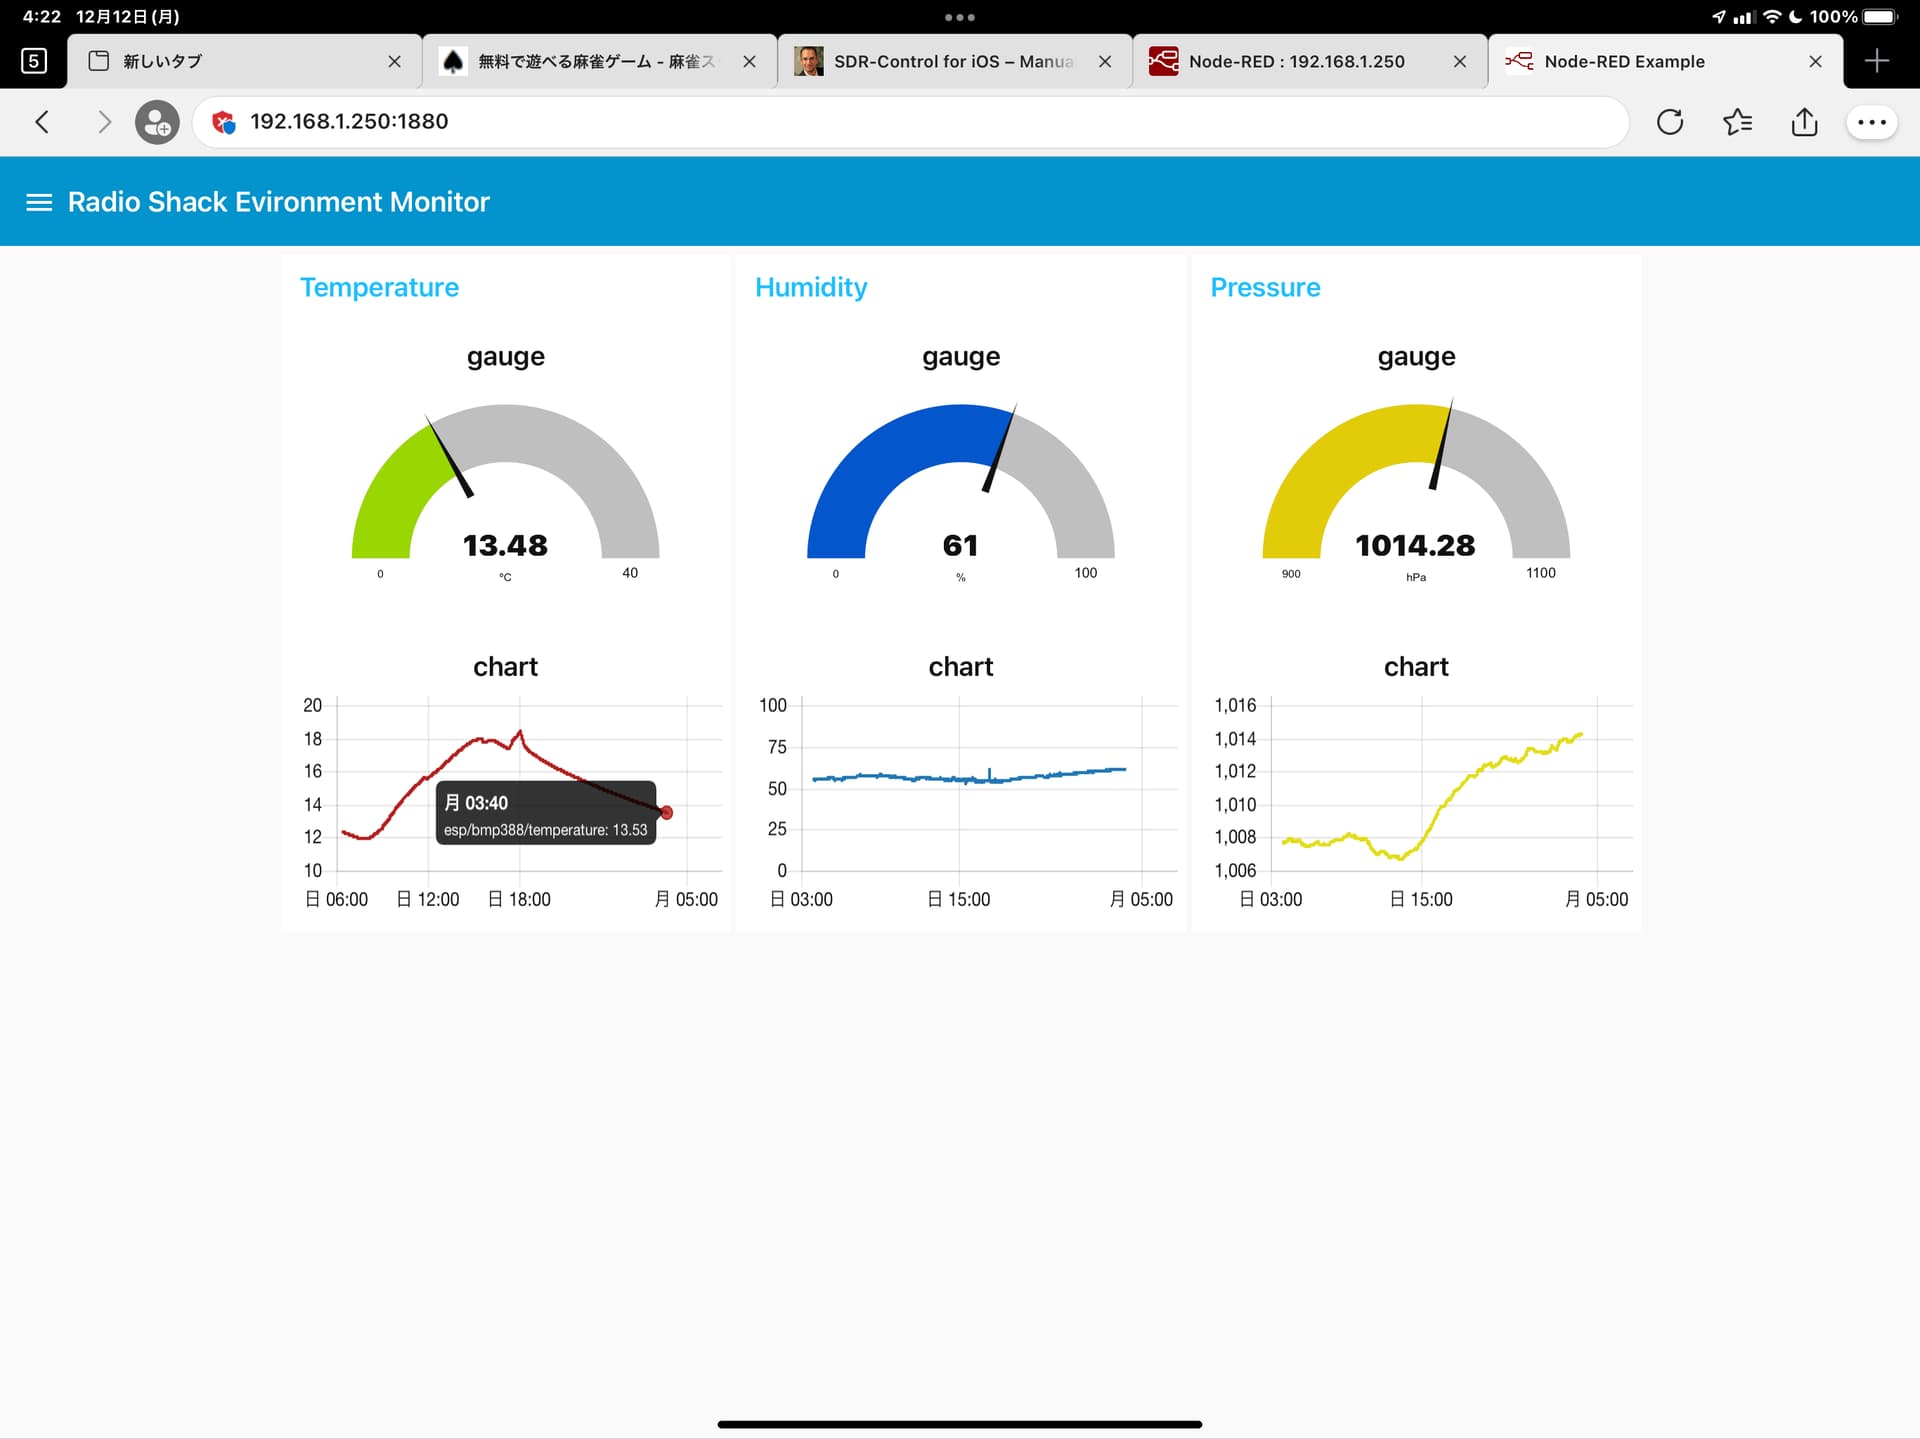
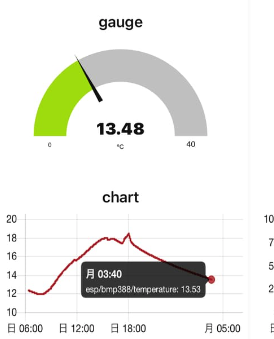
I’m attaching some latest screenshots.
It seems that time ranges shown in those charts are now 24 hours as I edited in the chart properties.
However, the latest dots still show around more than 30minutes ago.
The Node-RED is running on a local MQTT server on my Raspberry PI.
I thought the time stump in the debug window would be given at the Raspberry PI.
And the time on my iPad which I run Web browser (took those screenshots) were same as the latest time stump in the debug window.
Therefore, both time are almost same. (At lease the time gap should be less than a minutes, not more than 30minutes.)
Am I correct?
Sorry, I'm not seeing anything wrong with the timestamps. Where is this 30 minute difference?
And the last pressure reading in debug is the value on the gauge
I do see that you are getting MQTT messages every minute.
Not sure it would give any new information but you could add a text field below each chart to show when the chart was/should have been updated.
Use a change node to set msg.payload to timestamp, node-red-contrib-moment time formatter node to convert it to a date/time string and feed it into the text field.
Thanks again.
I will add the node tonight (I have to leave home now.)
BTW, where is “Date/Time Formatter” node?
I couldn’t find the node in the node pallet.
It's node-red-contrib-moment, you have to install it.
Ah. Thanks! I missed that, only looking at the pressure gauge.
No, The time shown in the debug panel is the browser's time.
I just set my PC time wrong by 15 minutes and checked, debug messages show the wrong time.
As @Colin has suggested, you need to check with the date command on the Pi.
It should automatically synchronise from the internet, but that doesn't always work.
As my Raspberry Pi has synchronized to my local time server connecting to GPS since the last boot at least, I think the time of Pi would be correct (I mean there is no such big time gap.).
But I will check the Pi time and report to you when I back home tonight JST (9 hours earlier than UTC).
And also I will install and add the “Date/Time Formatter” node to the flow, and will take all relating screenshots at almost same time and send you tonight.
I found the big delay in the time of the Pi and corrected.
After that, I confirmed that there was no difference between the time of the last dot and the actual time.
Thank you for your supports and I’m sorry I bother you.