As my subject, can the chart display a data every 10uS?
No. Given that your monitor refresh rate is 120Hz/100Hz at best, more typ. 60Hz/50Hz, it cannot display 100000 chart images per second.
100Mhz? Your best bet will be to keep the min, ave and max per second.
What I mean is, append data every 10uS.
What is your use case?
Why do you need such a high rate?
If it could do that then a chart 1000 pixels wide would scroll completely every 10ms so you would be unlikely to have time to see anything.
I am planning to datalog every 10uS for my switching power supply. My switching frequency or period is 100kHz/10uS.
Data like: ADCVout value, error value among others.
It should be ok, as long as I can save the data for analysis afterward.
100,000 data points stored to a database would be
6M per minute,
360M per hour
8.64G per day
60.48G per week
Do you have a database and computer able to run that many inserts that fast and enough storage to save it?
Node-red isn't made for high speed data thougput. The only why to get an answer is to try it. Because it will depend on many factors.
- The computer you are running it on
- The way you sample it: single samples or multiple samples packed together? If you use single sample per message you will have a lot of overhead.
- What hardware will you use to sample?
- What communication will you use?
- File format? CSV will be a hell to deal with with this amount of data.
I think node-red is not the tool for this job. Maybe look into Labview. It has a free community version since some years ago
This is for short time analysis like an oscilloscope.
I plan to use it like an oscilloscope and be able to save and analyze the data later on.
If this is the case, maybe python or other software will be more sufficient and not Node-Red, thanks for the reply and I will not pursue this endeavor.
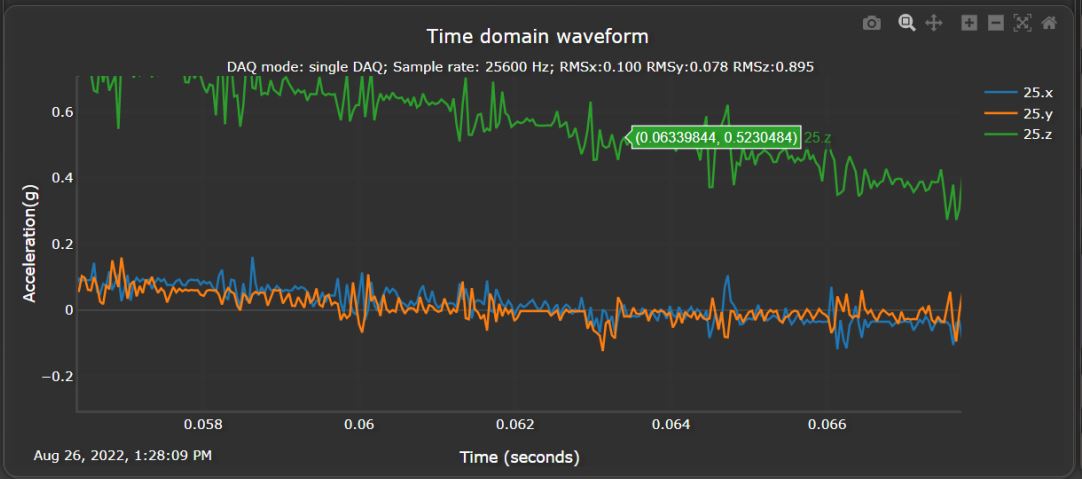
It is possible. You have to use the template UI node with other charts plug in such as Highcharts, ECharts, etc. For some chart plugin, you need to convert the time to strings for microsecond display (Most of the charts only have millisecond resolution).
Here is a screen shot with microsecond resolution display using Node-RED dashboard and ploty.js plug in. The data was taken with Broadsens wireless vibration sensor SVT200-A.