I’ve started to capture frequent energy readings and I’m trying to graph them, over an hour, day, week etc, but I can’t seem to make the graphs appear wider ? If I go in to the settings, and try to change it away from auto, the max width I can do seems to just be six wide?
I’ve noticed that these graphs take a very time to load, and I’ve noticed connection errors after a while. Do you (or anyone reading this) know the best way for frequent data like hoke energy readings to be processed ?
It can depend a lot on how much data you are asking them to hold and process and how fast the data is arriving. Most charts about 6 "units" wide are only about 300 pixels so showing 1000s of datapoints into that space is always asking for trouble. Likewise data arriving multiple times a second means lots of shifting data around even if being dropped from the end of the array. You may need to sample/filter your data in order to optimise it for display.
A single measurement is arriving approximately every second, and with the graphs I’m looking to show the trend of those measurements over 1hr, 12hrs, 24hrs and a week.
I’ve enlarged the graph size, basically doubling the width from 6 to 12.
What would be the best way to manage this amount and frequency of data ?
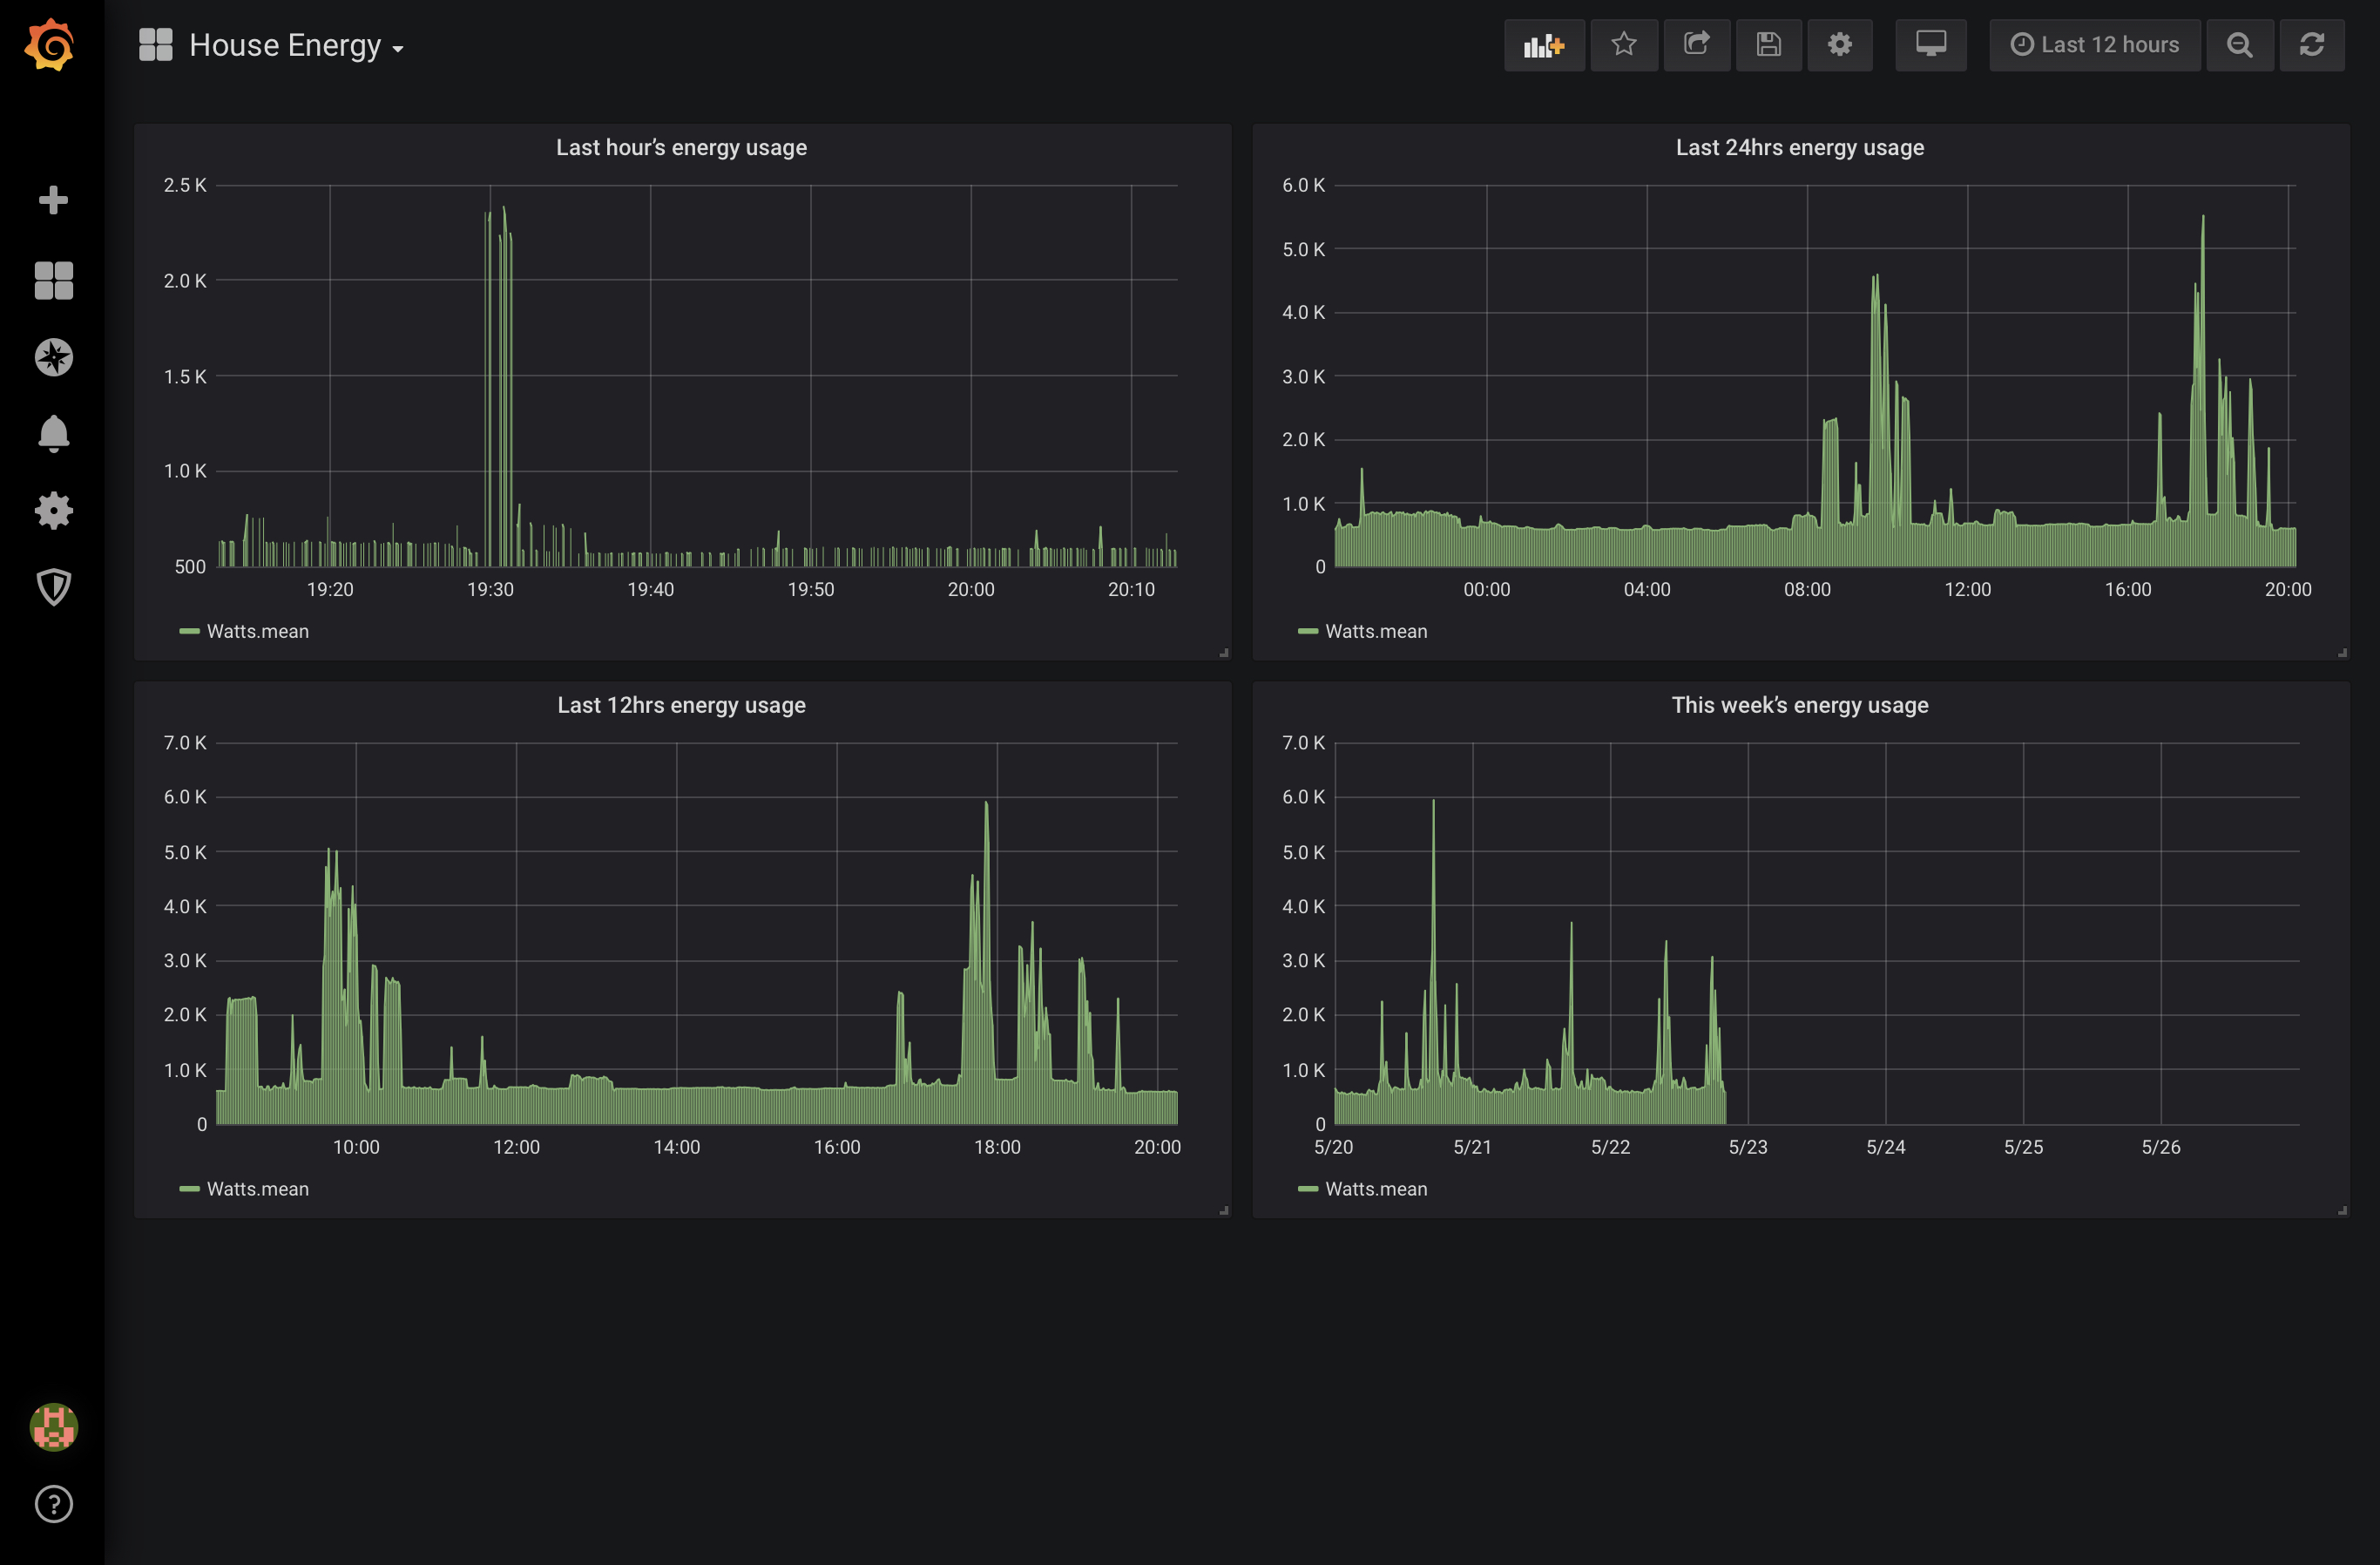
to be honest I would you look at something like Grafana for handling this much data.
(unless you are prepared to spend a lot of time pre filtering/accumulating data yourself before sending to dashboard)