Chart gone crazy - kind of. Missing time

I have a NodeMCU with a DHT11 connected.
It also has a 8 digit 7 segment display connected.

It sends data to my system via MQTT and it is displayed on a gauge and chart.

A couple of times how I've seen the display "spit the dummy" and go all weird.
(Crazy things on the display)
Then it clears and starts to display correctly again.

I thought I would see if the unit is actually dieing (yeah, ok how do you spell it? I seem to have forgotten.)

So I powered up this machine and looked at the NR main machine (.99) and what the dashboard says.

problem

It is 16:24 and the chars only shows data until 15:58. (See attached.)

The gauge and chart are getting real data as I see the gauge change as the value displayed on the Arduino changes. So the data is getting through.

But why the missing time?

Do you have debug node connected to the same output as your chart? If not, add one and see what data is being sent to the chart. Perhaps it's malformed somehow?

Well, as best I can see it isn't.

Granted it doesn't have a timestamp in there.
Which I guess is a problem.

But I thought (Yeah: dangerous) that the chart displayed data as it got it.
So if it gets a value "now" it shows it as "now" on the time time which I have the chart set up on the X axis.

I see you have a function labeled "ensure first". At a guess, this function is blocking or mutating data before sending to chart.

Add a debug node after that (to the same output your chart is connected).

Sorry, no, that is so the humidity and temperature have the correct colours on the chart.

So it waits for the temperature data to arrive first before allowing the data to flow.

I am really thinking that I need to set the timestamp in the message.
(But that needs to be done upstream of here.

I'm looking at this site: How to timestamp messages but I am not understanding it.

It goes on with:

You can also insert extra data points by specifying the timestamp property. This must be in either epoch time (in miliseconds, not seconds), or ISO8601 format.

{topic:"temperature", payload:22, timestamp:1520527095000}

But I am not getting how to inject the number/value.

Pretty sure you don't need to add timestamp to your message for the chart to populate.

However, for academic reasons...
var ts = Date.now();

So simply adding the var ts = Date.now(); into the function node will timestamp the message?

I have just (actually) noticed that ALL my charts are at the wrong time. About 30 minutes behind now, yet they are getting real time data.

Maybe you have a resource issue?

Try reopening your browser?
Try redeploy your full flow?

Can't help without seeing more tbh.

As Steve says, you don't need to attach the time. You just send a number to the chart. The debug you show isn't for the chart as the debug button is disabled. Please add a debug as Steve suggested and show us that output..

(Hi DCeeJay.)

(Read your reply.)
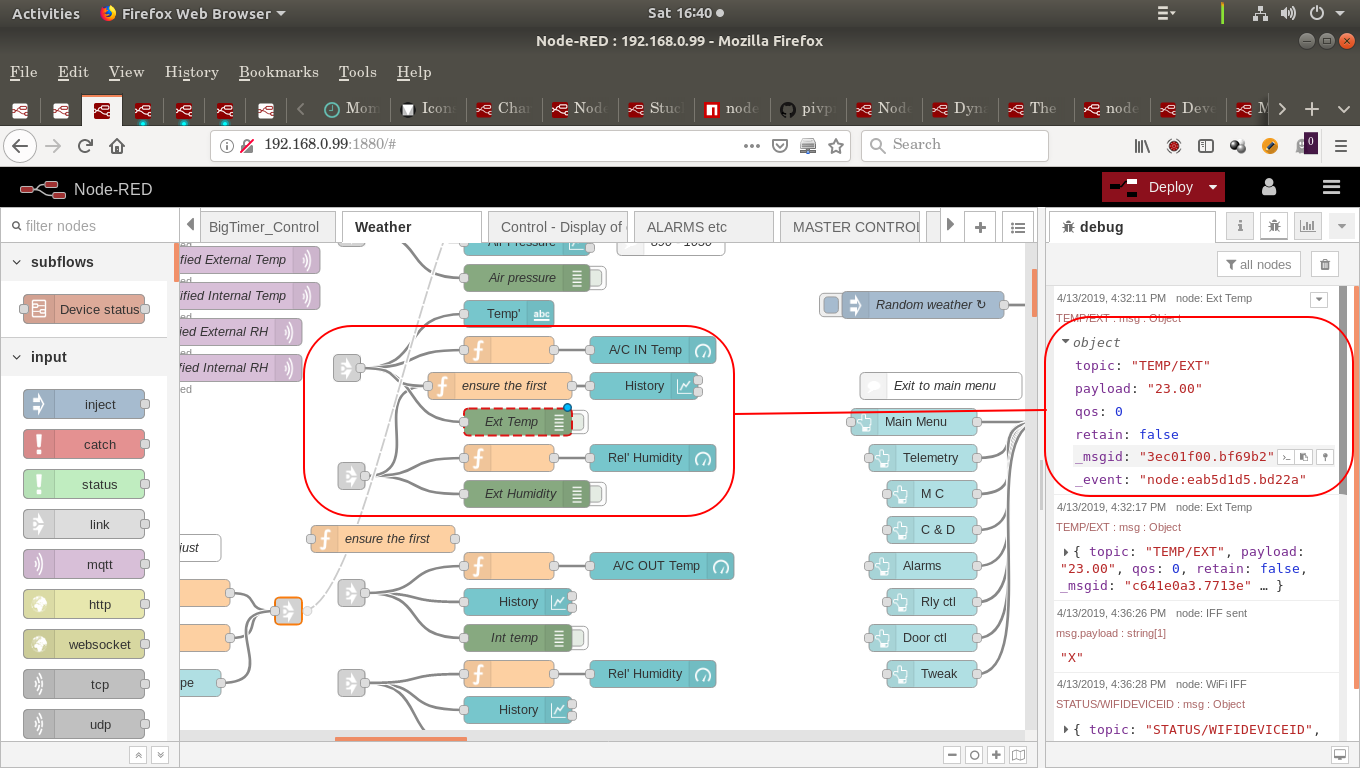
for clarity with the DEBUG node
Yes, it is disabled.

I injected the data and habitually disabled it when done, so if I needed to get back to it status quo the data would still be there.

The data in the screen shot is from that debug node.

(Annoyed that you can't put extra blank lines in for separation of paragraphs other than one line)

This is weird.

(Not to you Steve)

I've decided to minimalise the problem.

This is my test flow:
(Sorry it has a fan node in it to simplify switching what is connected to what.
See below screen shots.)

[{"id":"b8cb4c65.14521","type":"function","z":"baf80d2f.6bd538","name":"Add time","func":"var temperature = msg.payload;\nvar now = Date.now();\nmsg = {temperature: temperature, timestamp:now};\nreturn msg;\n","outputs":1,"noerr":0,"x":280,"y":2930,"wires":[[]]},{"id":"4aafd22.8baa5ac","type":"inject","z":"baf80d2f.6bd538","name":"","topic":"","payload":"foo","payloadType":"str","repeat":"","crontab":"","once":false,"onceDelay":0.1,"x":130,"y":2860,"wires":[["1a3051b4.30cfce"]]},{"id":"d6c6250d.65fbe","type":"debug","z":"baf80d2f.6bd538","name":"","active":true,"tosidebar":true,"console":false,"tostatus":false,"complete":"true","targetType":"full","x":650,"y":2930,"wires":[]},{"id":"1a3051b4.30cfce","type":"random","z":"baf80d2f.6bd538","name":"","low":"1","high":"10","inte":"true","property":"payload","x":280,"y":2860,"wires":[["b8cb4c65.14521","e6a6b5c1.9777b8"]]},{"id":"200ee33d.e3cf4c","type":"ui_chart","z":"baf80d2f.6bd538","name":"","group":"2c2e8aab.1813b6","order":0,"width":0,"height":0,"label":"Test","chartType":"line","legend":"false","xformat":"HH:mm:ss","interpolate":"linear","nodata":"Test","dot":false,"ymin":"","ymax":"","removeOlder":"4","removeOlderPoints":"","removeOlderUnit":"60","cutout":0,"useOneColor":false,"colors":["#010305","#aec7e8","#ff7f0e","#2ca02c","#98df8a","#d62728","#ff9896","#9467bd","#c5b0d5"],"useOldStyle":false,"outputs":1,"x":650,"y":2980,"wires":[[]]},{"id":"e6a6b5c1.9777b8","type":"fan","z":"baf80d2f.6bd538","x":510,"y":2930,"wires":[["d6c6250d.65fbe","200ee33d.e3cf4c"]]},{"id":"5fa25e69.6b3a4","type":"inject","z":"baf80d2f.6bd538","name":"wipe","topic":"","payload":"","payloadType":"date","repeat":"","crontab":"","once":false,"onceDelay":0.1,"x":350,"y":3060,"wires":[["b5c422f.8706c6"]]},{"id":"b5c422f.8706c6","type":"function","z":"baf80d2f.6bd538","name":"","func":"msg.payload = null;\nreturn msg;","outputs":1,"noerr":0,"x":500,"y":3060,"wires":[["200ee33d.e3cf4c"]]},{"id":"2c2e8aab.1813b6","type":"ui_group","name":"Group 2","tab":"ce4bcacd.5cc46","order":2,"disp":true,"width":6},{"id":"ce4bcacd.5cc46","type":"ui_tab","z":"","name":"VTEMP","icon":"dashboard","order":36,"disabled":false,"hidden":false}]

Forgive the FAN node. It just makes it easier to swap inputs to the chart and debug node.
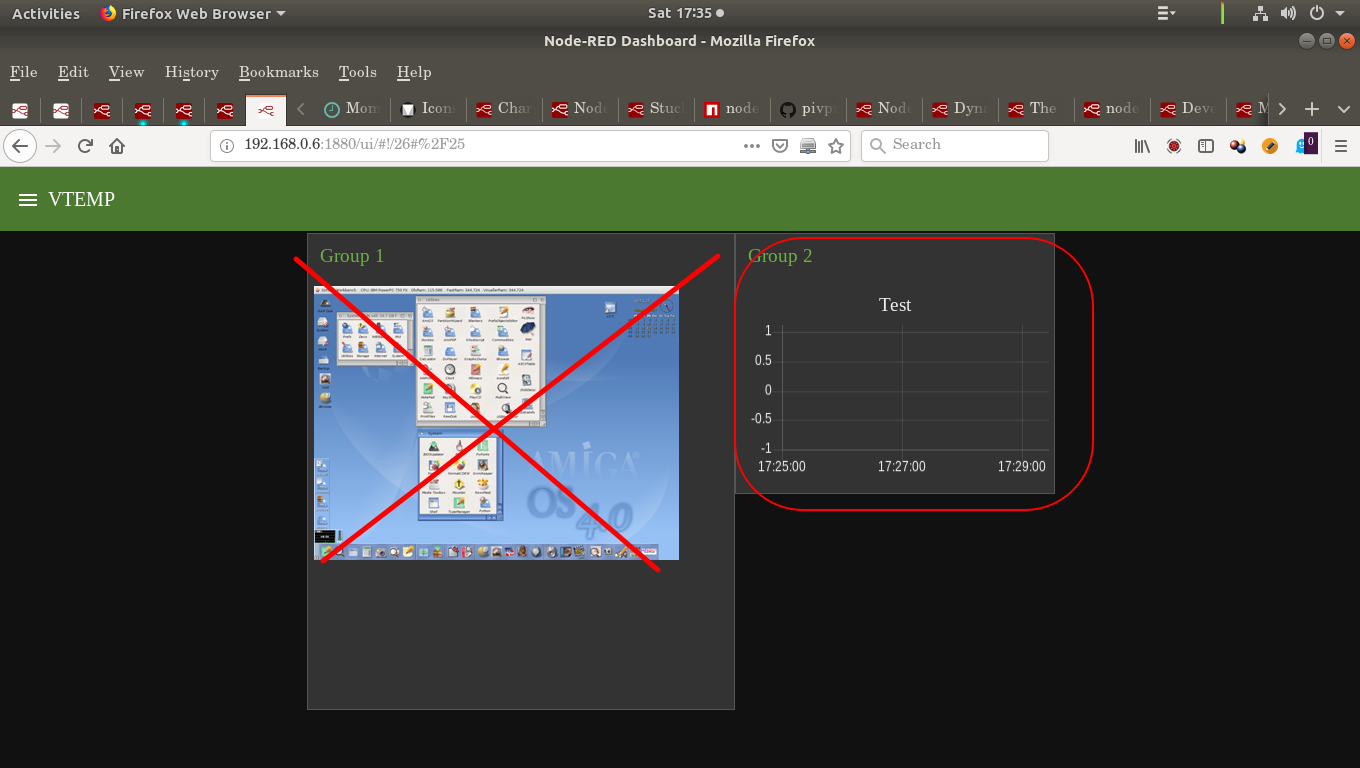
Here's the weird thing.

inject -- random (1-10 integer) -- chart and debug.

Setting the chart up for 4 minutes and slowly pressing the inject a few times with a few seconds apart, the char did show a a line. note it is (say) 17:30. The chart time was 17:00.

I then tried to add the function node and timestamp the data.
Didn't work. Dunno why. But indulge me for a second.

So, I disconnected the function node to the chart and connected the chart to the random node.

Pressed the inject node a few times as before.
nothing!!!

I don't get it.

I added a msg.payload = null; on the second inject node to wipe the chart.
That isn't working, other than I don't have any traces on it, but as I am not repeatedly pressing that inject node, the chart isn't showing any more lines when I press the original inject node to inject random data.

Screen shots for clarity.

To save time editing.....

Please read this.

It is (typically) now working with the basic stuff.

And looking at the times, they too are correct.

ON THIS chart.

(Minor edit...)
Well, maybe not 100% correct time, but definitely not 30 minutes off.
Maybe 1 minute or so.

Going back to real chart now.

(See pictures now)

This is on the real machine with the real code.

Flow code:
(Injection of pules every .... 20 seconds to get value.)

[{"id":"d1173d22.231328","type":"exec","z":"e2bd5a4e.5597e8","command":"/opt/vc/bin/vcgencmd measure_temp| sed 's/[^0-9]*//g'","addpay":false,"append":"","useSpawn":"false","timer":"","oldrc":false,"name":"Check Temp","x":1000,"y":360,"wires":[["eb4e770c.f31eb8","ca612501.b6c82"],[],[]]},{"id":"ca612501.b6c82","type":"function","z":"e2bd5a4e.5597e8","name":"Make number and set Topic","func":"msg.payload = Number(msg.payload)/10;\nmsg.topic=global.get('myDeviceName');\nmsg.topic =\"TEMP/\" + msg.topic;\nreturn msg;\n","outputs":1,"noerr":0,"x":1230,"y":360,"wires":[["a387d257.1f70e8","10449e73.e11b42","f7b5b05b.86162","8e79ab07.9c2fd8","879b04aa.db0d2"]]},{"id":"10449e73.e11b42","type":"ui_gauge","z":"e2bd5a4e.5597e8","name":"","group":"f1986590.13afa8","order":1,"width":"5","height":"4","gtype":"gage","title":"Temp","label":"Celcius","format":"{{value}}","min":"10","max":"80","colors":["#00b500","#e6e600","#ca3838"],"seg1":"56","seg2":"60","x":1480,"y":400,"wires":[]},{"id":"f7b5b05b.86162","type":"ui_chart","z":"e2bd5a4e.5597e8","name":"","group":"f1986590.13afa8","order":4,"width":"5","height":"3","label":"History","chartType":"line","legend":"false","xformat":"HH:mm:ss","interpolate":"linear","nodata":"","dot":false,"ymin":"","ymax":"","removeOlder":1,"removeOlderPoints":"","removeOlderUnit":"3600","cutout":0,"useOneColor":false,"colors":["#000000","#aec7e8","#ff7f0e","#2ca02c","#98df8a","#d62728","#ff9896","#9467bd","#c5b0d5"],"useOldStyle":false,"x":1491.5,"y":443,"wires":[[],[]]},{"id":"f1986590.13afa8","type":"ui_group","z":"","name":"TimePi Local Telemetry","tab":"173dcde5.96e88a","order":1,"disp":true,"width":"8","collapse":false},{"id":"173dcde5.96e88a","type":"ui_tab","z":"","name":"Local Readings","icon":"dashboard","order":3,"disabled":false,"hidden":false}]

I'm no expert on the chart nodes but it was my understanding you simply pass the value in msg.payload and set the msg.topic to the axis title.

Nothing more than that is necessary I believe.

Yes.
And looking at my

post, you can see there is a small time difference from the time (top centre) of the screen and the time on the chart.

17:45 and 17:44:07. Though it seems that even the 17:44:07 is future on the chart's axis.

Then going to my next post you can see that the time is 17:47 (top of screen) yet if I go down to the chart and look at the last point plotted, it is 17:18:39
That's nearly 30 minutes behind.

I posted the flow (part) which has the node which gets the temperature, formats it and the chart, etc.

There isn't any sneaky stuff going on here.
Granted the other one I have shown has the other function node to sequence the messages - since discovered I could set the topic as series (or something) to negate that problem where the first set of data gets colour 1 and the second gets colour 2. Anyway.....

Outside the scope here.

So, this is situation as it stands with about 30 minutes difference between the real time and the data time on the chart.

:man_shrugging:

I am (probably and typically) missing an elephant somewhere.

Are you running the browser on the machine running node red (a pi?) or on another machine? If not the same then check the system time on the machine running node-red.

1 Like

I'm am idiot.

And that is my NTP machine!

SHAME ON ME!