Although I've been using the chart node for a while, I've never used its output before, but now I want to do some analysis of the data, and also save it for reloading on restarts (it's still very much early development, so there are a lot of those).
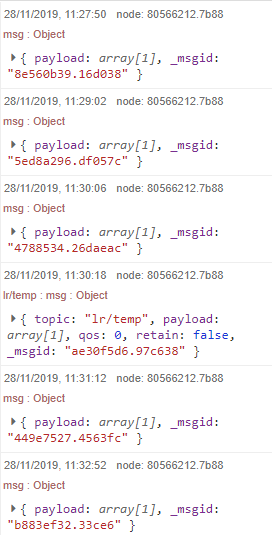
When I added a debug node to check what the data looked like, I found the chart was sending outputs at roughly regular intervals of around 60 to 90 seconds. These are shown in the attached debug pane image, which includes an expected output when the chart receives an input message from a temperature sensor.
There doesn't seem to be anything in the documentation which explains this "tick" output, and no settings for the node to adjust, or preferably disable it. If anyone knows how to modify this, I'd be grateful for any ideas.DebugOutput|254x500 .
