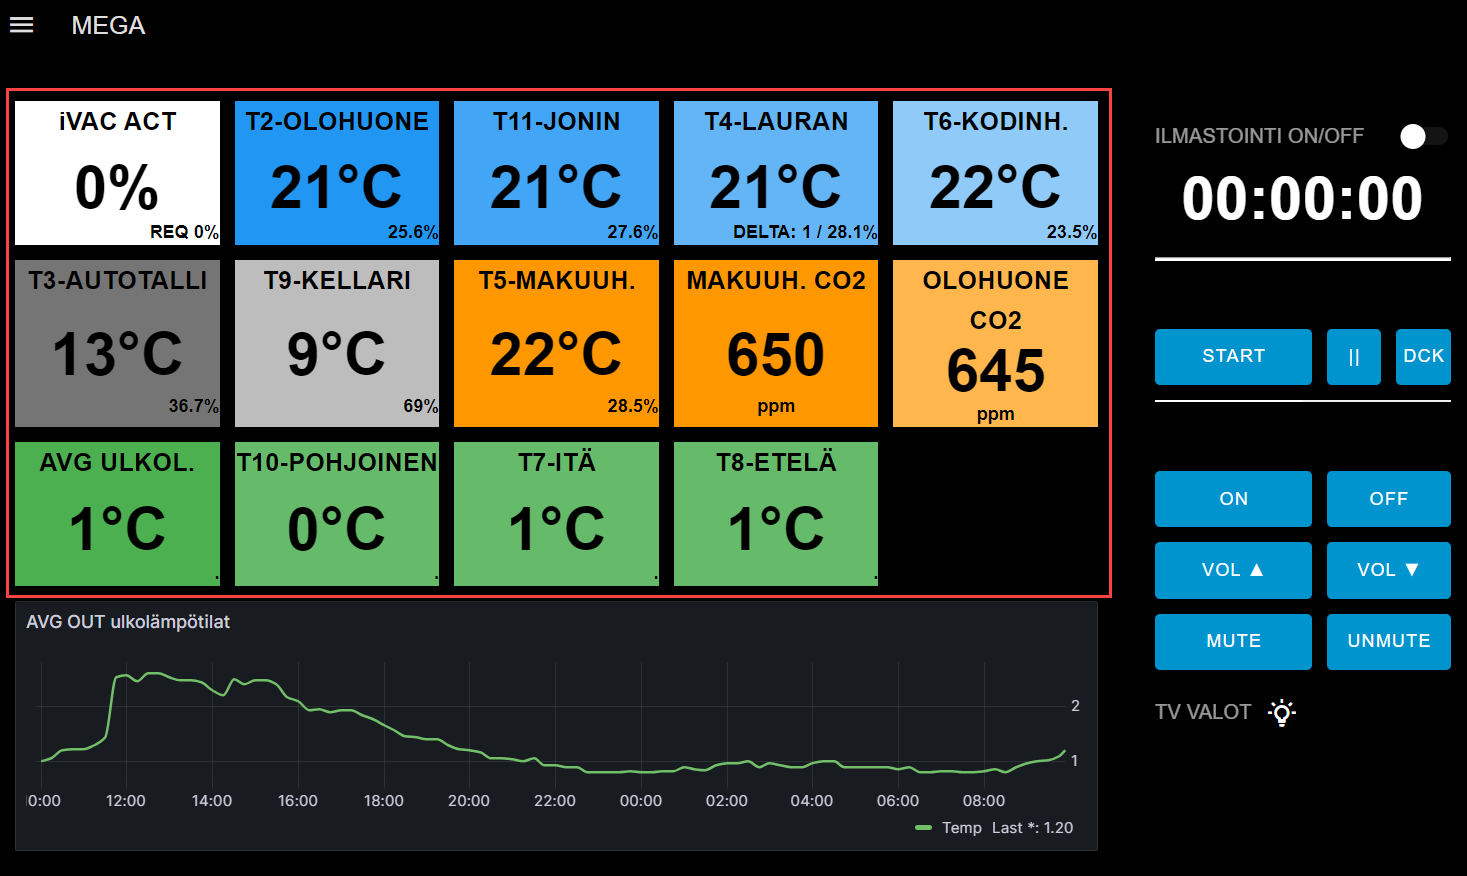
Hi, I have page with multiple Temperature and Humidity monitors. I have now transfered it to Dashboard 2 versions and having some intermittent ( typically after 16-24 hrs) freezing of those HTML elements (data is not updated correctly) on a always on tablet. Everything else like iFrame grafana embeddings and button / timer functions still work correctly though.
I did not have this issue in D1 version where I was using the ng-bind-html.
As in the new D2 version this does not work I used this to get it working ( with additional text formatting) , but as stated this give me sometimes frozen data results.
After additional testing I found out that the issue is that as I am learning new CSS/ JavaScript / Vuetify coding If Make make "Wrong Enough" code and deploy it then the Pge gets "Hanged" even though the applied code is not for that specific page.
Bug or a feature ?
Applying refresh load on the table assumes normal operations of the page again ( untill I make a new "wrong enough" code deployment ).
I created a html clock widget to understand when the page stops and on the system log file I found this when it stopped ? D2 is the name where all my pages reside.
10:11:03 SAMONE Node-RED[887]: 3 Mar 10:11:03 - [info] [ui-base:D2] Disconnected bFaAKBFddJvzUORBAAal due to ping timeout
Previously you said it hangs when have an error in the code. Is it now happening under a different situation or is this still caused by errors in the code?
Hi, Yes that was originally the assumption as I was trying (a lot ) to get the code working. But this time the freeze happened when I was not at the machine at all.
I tried to change the original text but I have lost possibility to edit it (again).
Aplogies for not beeing consistant in my ramblings
Looking on the time 10:10 no real changes on this. This used to be problem in D1 and was hoping D2 is not affected similarly (and data shows that to be true)
Memory leaks can be problem with Vue, vuetify, dashboard project or you create them by your coding. Blind blaming is worth nothing. But investigating is not trivial task. Specially for such kind of pretty large projects as dashboard + it's usage creates.
Great, thanks, it will be good to have this working well. #620 is fairly easy to reproduce and I am pretty sure it is the same issue (or at least part of it).