Hi,
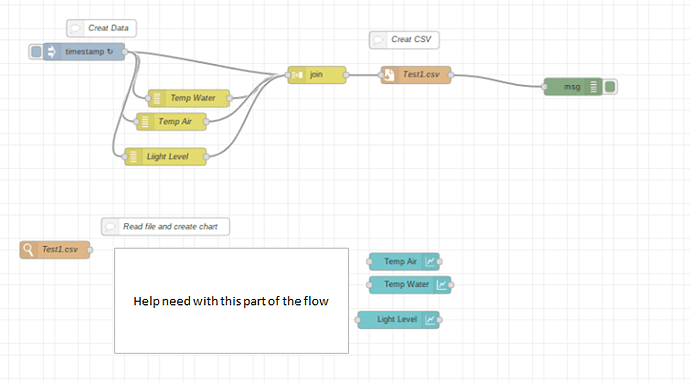
In the top part I create a CSV file from a time stamp and random data (could be from a sensor as well, 4 data sets Time stamp, Temp Water, Temp Air and Light Level)
In the bottom part I want to read the CSV and create a chart from it.
The chart needs to map the time stamp from the CSV against each of the data sets of the CSV (Temp Water, Temp Air and Light Level), lots missing here.
If there is a example of this somewhere I will appreciate it.

[{"id":"9da0f9d0.11eb48","type":"tab","label":"Chart - Create CSV and Read","disabled":false,"info":""},{"id":"73e3db38.df58c4","type":"ui_chart","z":"9da0f9d0.11eb48","name":"","group":"f8c9ca84.797328","order":2,"width":0,"height":0,"label":"Light Level","chartType":"line","legend":"true","xformat":"HH:mm","interpolate":"step","nodata":"","dot":false,"ymin":"","ymax":"","removeOlder":"1","removeOlderPoints":"","removeOlderUnit":"3600","cutout":0,"useOneColor":false,"colors":["#1f77b4","#aec7e8","#ff7f0e","#2ca02c","#98df8a","#d62728","#ff9896","#9467bd","#c5b0d5"],"useOldStyle":false,"outputs":1,"x":690,"y":580,"wires":[[]]},{"id":"a5eb28ee.f1d8d8","type":"watch","z":"9da0f9d0.11eb48","name":"Test1.csv","files":"/home/pi/Documents/Data/Test1.csv","recursive":"","x":100,"y":460,"wires":[[]]},{"id":"447fe7ae.e75ca8","type":"debug","z":"9da0f9d0.11eb48","name":"","active":true,"tosidebar":true,"console":false,"tostatus":false,"complete":"true","targetType":"full","x":990,"y":180,"wires":[]},{"id":"3edc8923.107b76","type":"file","z":"9da0f9d0.11eb48","name":"Test1.csv","filename":"/home/pi/Documents/Data/Test1.csv","appendNewline":true,"createDir":false,"overwriteFile":"false","encoding":"utf8","x":720,"y":160,"wires":[["447fe7ae.e75ca8"]]},{"id":"970d173f.7712e8","type":"join","z":"9da0f9d0.11eb48","name":"","mode":"custom","build":"string","property":"payload","propertyType":"msg","key":"topic","joiner":",","joinerType":"str","accumulate":false,"timeout":"","count":"4","reduceRight":false,"reduceExp":"","reduceInit":"","reduceInitType":"","reduceFixup":"","x":550,"y":160,"wires":[["3edc8923.107b76"]]},{"id":"3f24e5f.939f31a","type":"inject","z":"9da0f9d0.11eb48","name":"","topic":"","payload":"","payloadType":"date","repeat":"30","crontab":"","once":true,"onceDelay":0.1,"x":150,"y":120,"wires":[["970d173f.7712e8","fc2277c6.fb6428","8b35e2fe.ba7f5","79c73f17.7b3ad"]]},{"id":"fc2277c6.fb6428","type":"random","z":"9da0f9d0.11eb48","name":"Temp Water","low":"-5","high":"45","inte":"true","property":"payload","x":330,"y":200,"wires":[["970d173f.7712e8"]]},{"id":"8b35e2fe.ba7f5","type":"random","z":"9da0f9d0.11eb48","name":"Temp Air","low":"-5","high":"45","inte":"true","property":"payload","x":300,"y":240,"wires":[["970d173f.7712e8"]]},{"id":"79c73f17.7b3ad","type":"random","z":"9da0f9d0.11eb48","name":"Liight Level","low":"0","high":"100","inte":"true","property":"payload","x":290,"y":300,"wires":[["970d173f.7712e8"]]},{"id":"655223a9.7377ac","type":"comment","z":"9da0f9d0.11eb48","name":"Creat Data","info":"","x":180,"y":80,"wires":[]},{"id":"1b3a42a4.b61d6d","type":"comment","z":"9da0f9d0.11eb48","name":"Creat CSV","info":"","x":700,"y":100,"wires":[]},{"id":"83399b3.ae38068","type":"comment","z":"9da0f9d0.11eb48","name":"Read file and create chart","info":"","x":290,"y":420,"wires":[]},{"id":"a9759e6e.0ce49","type":"ui_chart","z":"9da0f9d0.11eb48","name":"","group":"f8c9ca84.797328","order":2,"width":0,"height":0,"label":"Temp Air","chartType":"line","legend":"true","xformat":"HH:mm","interpolate":"step","nodata":"","dot":false,"ymin":"","ymax":"","removeOlder":"1","removeOlderPoints":"","removeOlderUnit":"3600","cutout":0,"useOneColor":false,"colors":["#1f77b4","#aec7e8","#ff7f0e","#2ca02c","#98df8a","#d62728","#ff9896","#9467bd","#c5b0d5"],"useOldStyle":false,"outputs":1,"x":700,"y":480,"wires":[[]]},{"id":"765a80d.47d948","type":"ui_chart","z":"9da0f9d0.11eb48","name":"","group":"f8c9ca84.797328","order":2,"width":0,"height":0,"label":"Temp Water","chartType":"line","legend":"true","xformat":"HH:mm","interpolate":"step","nodata":"","dot":false,"ymin":"","ymax":"","removeOlder":"1","removeOlderPoints":"","removeOlderUnit":"3600","cutout":0,"useOneColor":false,"colors":["#1f77b4","#aec7e8","#ff7f0e","#2ca02c","#98df8a","#d62728","#ff9896","#9467bd","#c5b0d5"],"useOldStyle":false,"outputs":1,"x":710,"y":520,"wires":[[]]},{"id":"f8c9ca84.797328","type":"ui_group","z":"","name":"Test1","tab":"ba411c2a.41819","order":2,"disp":true,"width":"6","collapse":false},{"id":"ba411c2a.41819","type":"ui_tab","z":"","name":"Test 1","icon":"dashboard","order":2,"disabled":false,"hidden":false}]
Resulting chart need to be something like this


