How do I create a chart from a csv file, the x axis should be dt column and y axis should be AverageTemperature column.
Here is the sample data from the csv file
dt,value
1865-01-01,25
1865-02-01,23
1865-03-01,27
....
How do I create a chart from a csv file, the x axis should be dt column and y axis should be AverageTemperature column.
Here is the sample data from the csv file
dt,value
1865-01-01,25
1865-02-01,23
1865-03-01,27
....
Just to be clear, is the dt column dates? So the first row is January 1st 1865?
Yeah, dt column is dates @zenofmud
You should take a read of this https://github.com/node-red/node-red-dashboard/blob/master/Charts.md#stored-data
@zenofmud But how do I specify to use the dt column containing date to be used as x axis?
@Andrei Can you please help me out?
Did you read the section on stored data? You need to format your data as it shows, therefore you will need to change the dates into milliseconds
Hi @noob96 What @zenofmud is saying (in visual terms) is...
Have a read of this thread - I visually explained this process for someone else here
some clues...
parseInt"The chart input layout is a bit convoluted but this example might help you on your way.
In the change node you can reformat the csv array with jsonata like this:
[
   {
       "labels":[""],
       "series":["avgTemp"],
       "data": [
           [
               $map(
                   payload.col1,
                   function($v, $i, $a) {
                       {
                           'x': $v,
                           'y':payload[$i].col2
                }
            }
            )
        ]
       ]
   }
]
Example flow, change the input file to your own.
[{"id":"907cdda1.572108","type":"inject","z":"eb03e9b6.874b98","name":"","topic":"","payload":"","payloadType":"date","repeat":"","crontab":"","once":false,"onceDelay":0.1,"x":156,"y":600,"wires":[["93224ee6.01a31"]]},{"id":"93224ee6.01a31","type":"file in","z":"eb03e9b6.874b98","name":"input file","filename":"/home/administrator/input.csv","format":"utf8","chunk":false,"sendError":false,"encoding":"none","x":300,"y":600,"wires":[["18e0237d.190ead"]]},{"id":"18e0237d.190ead","type":"csv","z":"eb03e9b6.874b98","name":"","sep":",","hdrin":"","hdrout":"","multi":"mult","ret":"\\n","temp":"","skip":"1","strings":true,"x":434,"y":600,"wires":[["b483c0d9.45e35"]]},{"id":"de8f8a17.0366e","type":"debug","z":"eb03e9b6.874b98","name":"","active":true,"tosidebar":true,"console":false,"tostatus":false,"complete":"false","x":790,"y":552,"wires":[]},{"id":"b483c0d9.45e35","type":"change","z":"eb03e9b6.874b98","name":"","rules":[{"t":"set","p":"payload","pt":"msg","to":"[\t {\t \"labels\":[\"\"],\t \"series\":[\"avgTemp\"],\t \"data\": [[\t $map(\t payload.col1,\t function($v, $i, $a) {\t {\t 'x': $v,\t 'y':payload[$i].col2 \t } \t }\t ) \t ]]}\t]\t","tot":"jsonata"}],"action":"","property":"","from":"","to":"","reg":false,"x":584,"y":600,"wires":[["de8f8a17.0366e","54a1aab.9bdf654"]]},{"id":"54a1aab.9bdf654","type":"ui_chart","z":"eb03e9b6.874b98","name":"","group":"fbe55673.66dd98","order":1,"width":0,"height":0,"label":"test","chartType":"line","legend":"false","xformat":"Y-M-D","interpolate":"cubic","nodata":"","dot":false,"ymin":"","ymax":"","removeOlder":1,"removeOlderPoints":"","removeOlderUnit":"86400","cutout":0,"useOneColor":false,"useUTC":false,"colors":["#1f77b4","#aec7e8","#ff7f0e","#2ca02c","#98df8a","#d62728","#ff9896","#9467bd","#c5b0d5"],"useOldStyle":false,"outputs":1,"x":770,"y":648,"wires":[[]]},{"id":"fbe55673.66dd98","type":"ui_group","name":"Group 1","tab":"3a6d7b89.06bd5c","order":1,"disp":true,"width":13},{"id":"3a6d7b89.06bd5c","type":"ui_tab","name":"Tab 6","icon":"dashboard","order":6}]
Chart output
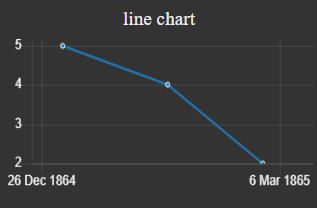
Hi @Steve-Mcl, I appreciate your help. To test, I converted 3 dates, [1865-Jan-01, 1865-Feb-01, 1865-Mar-01] to timestamp and try to get the chart. But the chart the doesn't the exact date when plotting the points


should i change anything in line chart properties

The chart looks correct to me. Is it that the x axis annotation is at 29th Dec and 6th March, but you would prefer the end points on the axis to be exactly the end points that you fed in, rather than having a bit of a gap at each end?
Oh..my mistake. Let me try with the correct epochs
I want to show each data point with its associated date present in the x axis
I have provided a flow that works, you can set your own input file.
The label for the first data point should be its date

which should 1865-Jan-1.
@Steve-Mcl I corrected the epochs but still I'm not getting the x axis data as the date of the indivdual datapoints
Thank you, I try it now
And you don't have to insert epoch:
This must be in either epoch time (in miliseconds, not seconds), or ISO8601 format.
paste your flow (not a screen shot - they look great but node-red is rubbish at importing images & I aint writing your code out manually  )
)
Thank you it works