I have a template which uses the plotly library and when the page loads, I am getting an error in the console which I would like to eliminate. It appears the plotly library has not loaded prior to the template loading:
errorCaptured ReferenceError: Plotly is not defined
I would like to know what I am missing in order to have the library load prior to the call being made.
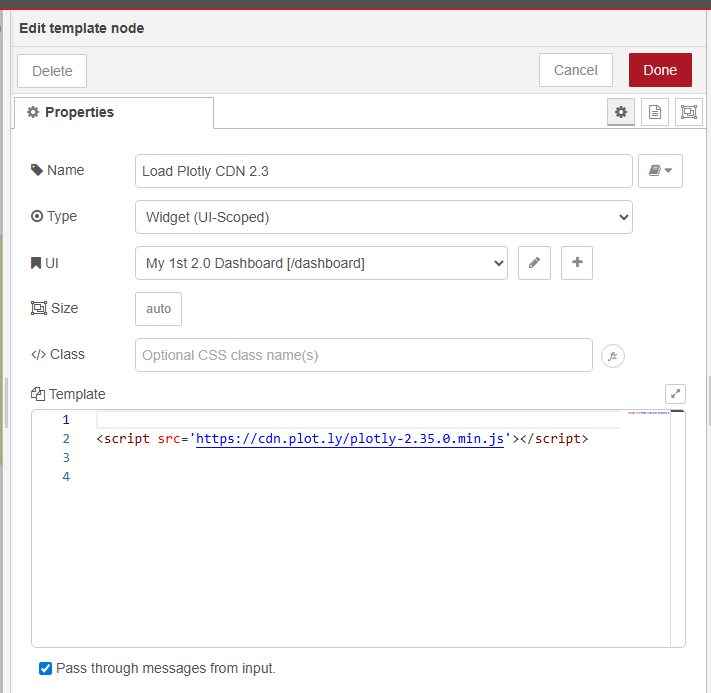
I have this template which is loading the library:
In a second template I am defining and displaying my graph:

This is an abbreviated version of the code:
<template>
    <h1>MMWave 2</h1>
    <div style='height: 100%;'>
        <!-- Had to set the height here to get the chart div to grow and fit the Plotly chart -->
        <div id='mmwave_chart'>
            <!-- Plotly chart will be drawn inside this DIV -->
        </div>
    </div>
</template>

<script>
    export default {
        data() {
            return {
                zone1: {
                    x: 0,
                    y: 0,...
                }
            }
        },
        watch: {
            //Watch for any changes to msg and act on them.
            //This is run when the dashboard is loaded as well
            msg: function () {
                this.draw();
            }
        },
        mounted() {
            // code here when the component is first loaded
            //setTimeout(this.draw(),2000);
                //this.draw();
         },
        methods: {
            draw () {
                var traceCoveredArea = {...
                };
                var traceZone1 = {
                    x: [...
                };

                var data = [traceCoveredArea, traceZone1];

                var layout = {
                    xaxis: {
                        side: 'top'
                    }
                };

                Plotly.react('mmwave_chart', data, layout) ;
                // Plotly.react is the same as Plotly.newPlot except that
                // when it receives a request to redraw it only calculates the changed data
            },
        }
    }
</script>
Export of both templates and the associated dashboard page items:
[{"id":"6f6bd4033ec6b55b","type":"ui-template","z":"01a9e096a69c7202","group":"","page":"","ui":"4c2bb00f7172c414","name":"Load Plotly CDN 2.3","order":0,"width":0,"height":0,"head":"","format":"\n<script src='https://cdn.plot.ly/plotly-2.35.0.min.js'></script>\n\n","storeOutMessages":true,"passthru":true,"resendOnRefresh":true,"templateScope":"widget:ui","className":"","x":2120,"y":320,"wires":[[]]},{"id":"1c84643e64afa80e","type":"ui-template","z":"01a9e096a69c7202","group":"0db8d9f5bdc794eb","page":"","ui":"","name":"Plotly mmwave test 2","order":3,"width":"12","height":"6","head":"","format":"<template>\n <h1>MMWave 2</h1>\n <div style='height: 100%;'>\n <!-- Had to set the height here to get the chart div to grow and fit the Plotly chart -->\n <div id='mmwave_chart'>\n <!-- Plotly chart will be drawn inside this DIV -->\n </div>\n </div>\n</template>\n\n<script>\n export default {\n data() {\n return {\n zone1: {\n x: 0,\n y: 0,\n height: 0,\n width: 0,\n timeout: 0,\n presence: 'OFF',\n target_counts: 0,\n info:'none'\n }\n }\n },\n watch: {\n //Watch for any changes to msg and act on them.\n //This is run when the dashboard is loaded as well\n msg: function () {\n this.draw();\n }\n },\n mounted() {\n // code here when the component is first loaded\n //setTimeout(this.draw(),2000);\n //this.draw();\n },\n methods: {\n draw () {\n var traceCoveredArea = {\n x: [0, 7500 * Math.sin((2 * Math.PI)/360 * 60), 6500, 5500, 4500, 4000, 3000, 2000, 1000, 0, -1000, -2000, -3000, -4000,\n -4500, -5500, -6500, -7500 * Math.sin((2 * Math.PI)/360 * 60), 0],\n y: [0, 7500 * Math.cos((2 * Math.PI)/360 * 60), Math.sqrt( 7500**2 - 6500**2 ),Math.sqrt( 7500**2 - 5500**2 ),\n Math.sqrt( 7500**2 - 4500**2 ), Math.sqrt( 7500**2 - 4000**2 ), Math.sqrt( 7500**2 - 3000**2 ), Math.sqrt( 7500**2 -\n 2000**2 ), Math.sqrt( 7500**2 - 1000**2 ), 7500, Math.sqrt( 7500**2 - 1000**2 ), Math.sqrt( 7500**2 - 2000**2 ),\n Math.sqrt( 7500**2 - 3000**2 ), Math.sqrt( 7500**2 - 4000**2 ), Math.sqrt( 7500**2 - 4500**2 ), Math.sqrt( 7500**2 -\n 5500**2 ), Math.sqrt( 7500**2 - 6500**2 ), 7500 * Math.cos((2 * Math.PI)/360 * 60), 0],\n mode: 'lines',\n name: 'Covered Area',\n line: {shape: 'linear', dash: 'dash', color:'gainsboro'},\n type: 'scatter'\n };\n var traceZone1 = {\n x: [\n this.zone1.x,\n this.zone1.x - this.zone1.width * Math.cos((this.sensor_angle)*3.1415/180),\n this.zone1.x - this.zone1.width * Math.cos((this.sensor_angle)*3.1415/180) + this.zone1.height\n * Math.cos((this.sensor_angle*1-90)*3.1415/180),\n this.zone1.x*1 + this.zone1.height * Math.cos((this.sensor_angle*1-90)*3.1415/180),\n this.zone1.x*1\n ],\n y: [\n this.zone1.y*1,\n this.zone1.y*1 + this.zone1.width * Math.sin((this.sensor_angle)*3.1415/180),\n this.zone1.y*1 + this.zone1.width * Math.sin((this.sensor_angle)*3.1415/180) +\n this.zone1.height * Math.sin((this.sensor_angle*1+90)*3.1415/180),\n this.zone1.y*1 + this.zone1.height * Math.sin((this.sensor_angle*1+90)*3.1415/180),\n this.zone1.y*1\n ],\n mode: 'lines+markers',\n name: 'Zone 1',\n line: {shape: 'linear', color:'MediumAquaMarine'},\n fill: \"toself\",\n type: 'scatter'\n };\n\n var data = [traceCoveredArea, traceZone1];\n\n var layout = {\n xaxis: {\n side: 'top'\n }\n };\n\n Plotly.react('mmwave_chart', data, layout) ;\n // Plotly.react is the same as Plotly.newPlot except that\n // when it receives a request to redraw it only calculates the changed data, making it faster\n },\n }\n }\n</script>","storeOutMessages":true,"passthru":true,"resendOnRefresh":true,"templateScope":"local","className":"","x":2120,"y":360,"wires":[[]]},{"id":"4c2bb00f7172c414","type":"ui-base","name":"My 1st 2.0 Dashboard","path":"/dashboard","includeClientData":true,"acceptsClientConfig":["ui-notification","ui-control"],"showPathInSidebar":false,"headerContent":"page","navigationStyle":"default","titleBarStyle":"default","notificationDisplayTime":5},{"id":"0db8d9f5bdc794eb","type":"ui-group","name":"My Group","page":"92d2e5483adf6001","width":"12","height":"6","order":1,"showTitle":true,"className":"","visible":"true","disabled":"false","groupType":"default"},{"id":"92d2e5483adf6001","type":"ui-page","name":"Simulation","ui":"4c2bb00f7172c414","path":"/page7","icon":"home","layout":"grid","theme":"d8f055e104cc1454","breakpoints":[{"name":"Default","px":"0","cols":"3"},{"name":"Tablet","px":"576","cols":"6"},{"name":"Small Desktop","px":"768","cols":"9"},{"name":"Desktop","px":"1024","cols":"12"}],"order":2,"className":"","visible":true,"disabled":"false"},{"id":"d8f055e104cc1454","type":"ui-theme","name":"Default Theme","colors":{"surface":"#ffffff","primary":"#0094CE","bgPage":"#eeeeee","groupBg":"#ffffff","groupOutline":"#cccccc"},"sizes":{"pagePadding":"12px","groupGap":"12px","groupBorderRadius":"4px","widgetGap":"12px"}}]