How to add/use external libraries in flexdash? (plotly.js)

Simple question, but could not find anything in the docs (maybe I'm blind?). Would be cool if it was possible to import external js files via header. Similar to this (node-red-dashboard):

image

Edit: I mean there is this. But if I add another <script> section to the custom widget I get errors.

1 Like

It's too new to be in the docs.

The way it's supposed to work (take a look at the echart custom node we did several iterations on) is that you add the ESM module import to the config tab of the custom node. But I'm seeing that plotly doesn't provide an ESM build :roll_eyes:. I probably can find an ESM build but I need to run, so, the quick and dirty solution is to add the script tag dynamically. I can't test this, but something like the following, inserted right after the Vue component script tag:

const head = document.getElementsByTagName('head')[0];
const script = document.createElement('script');
script.setAttribute('src', 'https://cdn.plot.ly/plotly-2.16.1.min.js');
head.appendChild(script);

And then just use Plotly in your code as in the examples Getting started in JavaScript

Not exactly answering your question.... but another option is to load libraries by serving the files using httpStatic

If you are not familiar with httpStatic enable it in your settings.js file, and provide the path to where you intend to store the files.
httpStatic: '/home/pi/node-red-static/',

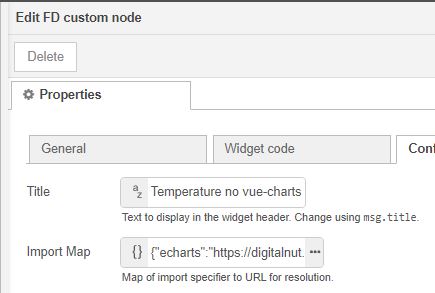
So if you dropped plotly.min.js into that location, the URL to access is would be something similar to http://yourdomain.com:8443/plotly.min.js

...Then copy that URL into the Import Map box of the FD Custom node.

It speeds things up considerable, and is no longer internet or CDN dependant.

url

1 Like

Thanks. I am using httpStatic already, so this approach would be preferable. Unfortunately, I cannot access Plotly yet.

The path seems to be correct:
image

If you open the url in a browser, do you see the plotly code?

I also tried to get a plotly example working a few days ago using CDN, but it failed :rage:
Please post if you get it working :wink:

Yes, the url is correct. Usually, I first try to run something like Plotly.version. I'll try a little longer - but I can't access the Plotly object from the browser console.

@tve your "hack" works! :upside_down_face:

( smiles quietly to himself about lack of docs…)

Plotly is there now lol .. I need to read the docs now regarding sizing and figure out how to "trigger" things at the right moment (when everything is loaded).

1 Like

please post the flow you have, even if it doesn't work yet

It works but it's ugly and I am nowhere near my goal:

[{"id":"3b73bf0142d0cbcc","type":"tab","label":"flexdash date tests","disabled":false,"info":"","env":[]},{"id":"21933cee466bf173","type":"flexdash custom","z":"3b73bf0142d0cbcc","fd_container":"a96ede31d15e8fcc","fd_cols":"5","fd_rows":"5","fd_array":false,"fd_array_max":10,"fd_output_topic":"","fd_loopback":false,"name":"Plotly","title":"Plotly","sfc_source":"<template>\n<div class=\"testerc\" id=\"tester\" @click=\"clicked\" >\nclick\n</div>\n\n\n</template>\n\n<style scoped>\n  .label { color: red; }\n  .testerc{width: 100%; height: 100%}\n</style>\n\n\n<script>\nconst head = document.getElementsByTagName('head')[0];\nconst script = document.createElement('script');\nscript.setAttribute('src', 'https://cdn.plot.ly/plotly-2.16.1.min.js');\nhead.appendChild(script);\n\n\nexport default {  \n  // Props are the inputs to the widget.\n  // They can be set dynamically using Node-RED messages using `msg.<prop>`.\n  // In a \"custom widget\" like this one they cannot be set via the Node-RED flow editor:\n  // use the default values in the lines below instead.\n  props: {\n    //payload: { default: {default: \"2022-12-31\", min: \"2022-12-31\", max: \"2022-12-31\"} }\n  },\n\n\n  //emits: ['send'], // declare to Vue that this component emits a 'send' event\n\n  // simple methods within the component\n  \n  methods: {\n    clicked(ev) {\n      //console.log(\"div clicked\", ev)\n      \n      var TESTER = document.getElementById('tester');\n      console.log(\"TESTER: \", TESTER);\n      \n      if(typeof Plotly == \"undefined\"){\n      console.log(\"Plotly not ready yet.\");\n      }else{\n      Plotly.newPlot( TESTER, [{\n      x: [1, 2, 3, 4, 5],\n      y: [1, 2, 4, 8, 16] }], {\n      margin: { t: 0 } } );\n      }\n      \n      //console.log(\"payload: \", this.payload)\n      //this.$emit('send', ev)\n    },\n  },\n  \n}\n\n</script>\n\n\n","import_map":{},"x":310,"y":40,"wires":[[]]},{"id":"a5fb45385eef4778","type":"flexdash ctrl","z":"3b73bf0142d0cbcc","name":"","fd":"8c6540ab2d9a3573","weak_fd":"","fd_output_topic":"","x":110,"y":100,"wires":[["9d2678a947c1934d"]]},{"id":"9d2678a947c1934d","type":"debug","z":"3b73bf0142d0cbcc","name":"debug 98","active":true,"tosidebar":true,"console":false,"tostatus":false,"complete":"false","statusVal":"","statusType":"auto","x":300,"y":100,"wires":[]},{"id":"a96ede31d15e8fcc","type":"flexdash container","name":"NFDC","kind":"StdGrid","fd_children":",7d8110bad209c9b4,e7c4f917522b9e07,73d471ead270d371,21933cee466bf173","title":"NFDC","tab":"1e908252f3517797","min_cols":"6","max_cols":"20","unicast":"ignore","parent":"","solid":false,"cols":"1","rows":"1"},{"id":"1e908252f3517797","type":"flexdash tab","name":"","icon":"mdi-view-dashboard","title":"Blub","fd_children":",a96ede31d15e8fcc","fd":"8c6540ab2d9a3573"}]
1 Like

Here's a start (I'm posting the source so others can see without having to import the node):

<template>
  <div class="w-100 h-100" ref="plotly">
  </div>
</template>

<script>
import Plotly from "plotly.js/dist/plotly.js"

export default {  
  // Props are the inputs to the widget.
  // They can be set dynamically using Node-RED messages using `msg.<prop>`.
  // In a "custom widget" like this one they cannot be set via the Node-RED flow editor:
  // use the default values in the lines below instead.
  props: {
    payload: { default: null }
  },

  mounted(ev) {
    Plotly.newPlot(
      this.$refs.plotly,
      [{
        x: [1, 2, 3, 4, 5],
        y: [1, 2, 4, 8, 16] }],
      { margin: { t: 0 } }
    );

    //console.log("payload: ", this.payload)
    //this.$emit('send', ev)
  },
  
}

</script>

And the config panel has and import map of:

{
    "plotly.js/dist/plotly.js": "https://ga.jspm.io/npm:plotly.js@2.7.0/dist/plotly.js"
}

Notes:

  • the w-100 and h-100 classes are utility formatting classes defined by Vuetify. (I think I want to switch to TailwindCSS, but that's not gonna happen overnight...)
  • the ref allows you to refer to the element in the code without having to concoct a globally unique ID
  • the import statement is equivalent to the script tag you had, but is scoped to the module, the "from" comes from ... let me skip that discussion ... but at some level it's actually unimportant
  • the import map maps this from value (plotly.js/dist/plotly.js) to a URL, what's important here is that:
    all plotly custom widgets must use the same import map
    this ensures that only one copy of plotly gets loaded
  • the widget only "runs" once the import completes, so you don't need to wait for anything
  • I'm drawing the chart you had in the mounted() lifecycle event

Little update:

[{"id":"e0dc4b448dc085ca","type":"flexdash custom","z":"3b73bf0142d0cbcc","fd_container":"a96ede31d15e8fcc","fd_cols":"5","fd_rows":"5","fd_array":false,"fd_array_max":10,"fd_output_topic":"","fd_loopback":false,"name":"Plotly Payload","title":"Plotly ESM","sfc_source":"<template>\n  <div class=\"w-100 h-100\" ref=\"plotly\">\n  </div>\n</template>\n\n<script>\nimport Plotly from \"plotly.js/dist/plotly.js\"\n\nexport default {  \n  props: {\n    payload: { default: null, type: Array },\n    options: { default: {}, type: Object }\n  },\n\n  data() { return {\n    plot: null,\n  }},\n\n  mounted() { this.create_plot() },\n\n  watch: {\n    payload: {\n      handler(v) { this.create_plot() },\n    },\n    options: { // skipping immediate 'cause payload already triggers\n      handler(v) { this.create_plot() }\n    },\n  },\n\n  methods: {\n    create_plot() {\n      if (this.plot) console.log(\"PLOT:\", Object.keys(this.plot))\n      if (!this.payload || !Array.isArray(this.payload) || this.payload.length == 0) return\n      this.plot = Plotly.newPlot(this.$refs.plotly, this.payload, this.options)\n      console.log(\"PLOT:\", Object.keys(this.plot))\n    },\n\n    // transpose from row format coming in to column format required by plotly\n    transpose(data) {\n      if (!data || data.length == 0) return []\n      if (!data[0].map) {\n        console.log(\"Plotly: cannot transpose\", data)\n        return []\n      }\n      let tr = data[0].map(() => Array(data.length))\n      data.forEach((d, i) => {\n        d.forEach((v, j) => {\n          tr[j][i] = v\n        })\n      })\n      return tr\n    },\n  },\n  \n}\n</script>","import_map":{"plotly.js/dist/plotly.js":"https://ga.jspm.io/npm:plotly.js@2.7.0/dist/plotly.js"},"x":340,"y":300,"wires":[[]]},{"id":"c6af11e3c9c37df2","type":"inject","z":"3b73bf0142d0cbcc","name":"","props":[{"p":"payload"},{"p":"options","v":"{\"margin\":{\"t\":0}}","vt":"json"}],"repeat":"","crontab":"","once":true,"onceDelay":0.1,"topic":"","payload":"[{\"x\":[1,2,3,4,5],\"y\":[1,2,4,8,16]}]","payloadType":"json","x":110,"y":300,"wires":[["e0dc4b448dc085ca"]]},{"id":"f411156a1e79de2c","type":"inject","z":"3b73bf0142d0cbcc","name":"","props":[{"p":"payload"}],"repeat":"","crontab":"","once":false,"onceDelay":0.1,"topic":"","payload":"[{\"x\":[1,2,3,4,5],\"y\":[1,16,2,8,4]}]","payloadType":"json","x":110,"y":340,"wires":[["e0dc4b448dc085ca"]]},{"id":"78673e91a6b52f72","type":"flexdash custom","z":"3b73bf0142d0cbcc","fd_container":"a96ede31d15e8fcc","fd_cols":"5","fd_rows":"5","fd_array":false,"fd_array_max":10,"fd_output_topic":"","fd_loopback":false,"name":"Plotly Row-Wise","title":"Plotly ESM","sfc_source":"<template>\n  <div class=\"w-100 h-100\" ref=\"plotly\">\n  </div>\n</template>\n\n<script>\n  import Plotly from \"plotly.js/dist/plotly.js\"\n\nexport default {  \n  props: {\n    payload: { default: null, type: Array },\n    options: { default: {}, type: Object }\n  },\n\n  data() { return {\n    plot: null,\n  }},\n\n  computed: {\n    columnar() {\n      if (!this.payload || !Array.isArray(this.payload)) return null\n      return this.transpose(this.payload)\n    }\n  },\n\n  // mounted happens after props and data are init'd\n  mounted() { this.create_plot() },\n\n  watch: {\n    payload(v) { this.create_plot() },\n    options(v) { this.create_plot() },\n  },\n\n  methods: {\n    create_plot() {\n      if (this.plot) console.log(\"PLOT:\", Object.keys(this.plot))\n      if (!this.columnar) return\n      const data = [{\n        'x': this.columnar[0],\n        'y': this.columnar[1],\n      }]\n      this.plot = Plotly.newPlot(this.$refs.plotly, data, this.options)\n      console.log(\"PLOT:\", Object.keys(this.plot))\n    },\n\n    // transpose from row format coming in to column format required by plotly\n    transpose(data) {\n      if (!data || data.length == 0) return []\n      if (!data[0].map) {\n        console.log(\"Plotly: cannot transpose\", data)\n        return []\n      }\n      let tr = data[0].map(() => Array(data.length))\n      data.forEach((d, i) => {\n        d.forEach((v, j) => {\n          tr[j][i] = v\n        })\n      })\n      return tr\n    },\n  },\n  \n}\n</script>","import_map":{"plotly.js/dist/plotly.js":"https://ga.jspm.io/npm:plotly.js@2.7.0/dist/plotly.js"},"x":340,"y":400,"wires":[[]]},{"id":"b50ee4623fd70013","type":"inject","z":"3b73bf0142d0cbcc","name":"","props":[{"p":"payload"},{"p":"options","v":"{\"margin\":{\"t\":0}}","vt":"json"}],"repeat":"","crontab":"","once":true,"onceDelay":0.1,"topic":"","payload":"[[1,1],[2,2],[3,4],[4,8],[5,16]]","payloadType":"json","x":110,"y":400,"wires":[["78673e91a6b52f72"]]},{"id":"92698a25d352ec43","type":"inject","z":"3b73bf0142d0cbcc","name":"","props":[{"p":"payload"}],"repeat":"","crontab":"","once":false,"onceDelay":0.1,"topic":"","payload":"[[1,1],[2,2],[3,1],[4,8],[5,1]]","payloadType":"json","x":110,"y":440,"wires":[["78673e91a6b52f72"]]},{"id":"a96ede31d15e8fcc","type":"flexdash container","name":"NFDC","kind":"StdGrid","fd_children":",7d8110bad209c9b4,e7c4f917522b9e07,73d471ead270d371,21933cee466bf173,0ca10a099f0a6969,1d8ee88fedb20405,e0dc4b448dc085ca,78673e91a6b52f72","title":"NFDC","tab":"1e908252f3517797","min_cols":"6","max_cols":"20","unicast":"ignore","parent":"","solid":false,"cols":"1","rows":"1"},{"id":"1e908252f3517797","type":"flexdash tab","name":"Repros","icon":"mdi-view-dashboard","title":"Repro","fd_children":",a96ede31d15e8fcc","fd":"e8f5aea52ab49500"}]

Notes:

  • The Plotly Payload widget accepts the full Plotly data.
  • The Plotly Row-wise widget accepts row-wise data like FlexDash TimePlot and the ui_chart
  • The boundary condition checking in the latter (payload with empty array) is probably insufficient. Also, it has 'x' and 'y' hardcoded. TimePlotRaw may be an inspiration: flexdash/time-plot-raw.vue at main · flexdash/flexdash · GitHub
  • In both I was looking for a way to delete the existing plot, I was expecting that the value returned by newPlot would have a delete() method or so, but nope. Maybe you just have to do something like this.$refs.plotly.replaceChildren() (untested). Evidently if you replace the plot you don't need to delete it first, so this would only be if payload==null or something like that.
  • The row-wise node only accepts a full plot, not incremental rows, I will probably add support for that kind of stuff (in the form of a custom msg handler function in the Custom widget), but it's not gonna happen immediately. In the meantime, you can place a node in front of the plotly one that accumulates rows and sends the full array out each time a new row arrives. Not the most efficient, but a work-around for now.
  • If you duplicate any of these nodes to get multiple graphs then all your code gets loaded umpteen times into FlexDash. Also, if you now want to change a line of code you have to go through all of them or reduplicate them. The ability to reuse custom widgets will be coming, but it's not gonna be tomorrow...
  • When you edit the custom widget code and re-deploy the hot-reload "has issues"... Ensure you close any open error message pop-up first (from the ERROR button) and use the browser reload (for FlexDash)...

I hope this gets you a little closer to your goal :wink:

Thank you very much!

I got "live data" working by using something like

Plotly.extendTraces(this.$refs.plotly, {
          x: [[payload.timestamp]],
          y: [[payload.value]]
        },
        
        [payload.channel_nbr]); // channel number, has to be an index!

My flow is still very messy and I have some init problems (again). But I'll post a version here soon.

I've been also wondering if I could pass the whole msg object to flexdash. This would make migration from the "old" dashboard a bit easier. Atm, I just pack everything into a payload object which works of course.

2 Likes

I don't understand... As you can see, in my example, I'm passing msg.payload and msg.options. You can add as many other props as you like. The input processing of the CustomWidget node discards any msg property that is not a prop on the node.

Note that this most likely isn't what you want in the end... By doing that you're appending locally in the browser. The moment you open another browser or reload you will see a plot with only the last value. That's why the TimePlot stuff has an array in node-red and when you append a data point it appends to the array and sends an append-to-array operation to FlexDash. If a new browser connects or reloads then it gets the full stored array, so all the browsers show the same data.

1 Like

I'm adding the data into a NR context object of course :wink: And after a browser refresh, all data from the memory gets loaded, at least that's how we did it with the node-red-dashboard.

I thought I could do something like

props: {
   msg: { default: {}, type: Object }
}

and then watch

watch: {
    msg(v) { // do something },
},

But that did not work.

1 Like

You need to add the deep option:

watch {
  msg: {
    deep: true,
    handler(v) { ... },
  },
}

This doesn't make for a nice interface though...

So, if anybody is interested to play with flexdash / plotly here's another messy flow :wink: Thanks again Thorsten for your help.

  • The plot data is being stored in an array (context of Node-RED) and it does not get lost after closing the browser tab. Also, one data line (CH3) receives random values every second
  • sometimes refresh (F5) fails, which I still need to figure out why (probably because of the delayed idle event I am (ab)using
[{"id":"bad040845be2efb7","type":"tab","label":"Flow 1","disabled":false,"info":"","env":[]},{"id":"9bcce05f35579a45","type":"flexdash custom","z":"bad040845be2efb7","fd_container":"a96ede31d15e8fcc","fd_cols":"5","fd_rows":"5","fd_array":false,"fd_array_max":10,"fd_output_topic":"","fd_loopback":false,"name":"Plotly","title":"Plotly ESM","sfc_source":"<template>\n  <div class=\"w-100 h-100\" ref=\"plotly\">\n  </div>\n</template>\n\n<script>\n  import Plotly from \"plotly.js/dist/plotly.js\"\n\nexport default {  \n  props: {\n    payload: { default: null, type: Array },\n    options: { default: {}, type: Object },\n    \n  },\n  emits: ['send'],\n\n  data() { return {\n    plot: null,\n  }},\n\n  computed: {\n    columnar() {\n      if (!this.payload || !Array.isArray(this.payload)) return null\n      return this.transpose(this.payload)\n    }\n  },\n\n  // mounted happens after props and data are init'd\n  mounted() { \n    console.log(\"mounted\")  \n    this.create_plot() \n  },\n\n  watch: {\n    payload(v) { this.plot_data(v) },\n    // options(v) { this.create_plot() },\n    \n  },\n\n  methods: {\n    create_plot() {\n      // rko: init empty plot\n      this.plot = Plotly.newPlot(this.$refs.plotly, [], {title: \"\", xaxis: {type: 'date'} }, { displaylogo: false, displayModeBar: true,\n      scrollZoom: true, autosize: true});\n\n      console.log(\"plot init done\")\n      this.$emit(\"send\", {\"plot_init_done\": true})\n      \n      //this.plot = Plotly.newPlot(this.$refs.plotly, data, this.options)\n      //console.log(\"PLOT:\", Object.keys(this.plot))\n      //console.log(\"payload: \", this.payload);\n    },\n\n    plot_data(payload){\n      \n      console.log(\"msg: \", payload);\n      if(payload.topic == \"measurement data\"){\n        Plotly.addTraces(this.$refs.plotly, {\n          type: \"scattergl\",\n          //mode: \"line\",\n          mode: \"spline\",\n          x: payload.data[0],\n          y: payload.data[1],\n          name: payload.data[2].name,\n          marker: {color: typeof payload.data[2].color == \"string\" ? payload.data[2].color : undefined },\n          visible: typeof payload.data[2].visible != \"undefiend\" ? payload.data[2].visible : true\n        }, payload.channel_nbr); // first trace is 0\n      \n      }else if(payload.topic == \"live data\"){\n        Plotly.extendTraces(this.$refs.plotly, {\n          x: [[payload.timestamp]],\n          y: [[payload.value]]\n        },\n        \n        [payload.channel_nbr]); // channel number, has to be an index!\n      }\n      \n\n    }\n\n  },\n  \n}\n</script>","import_map":{"plotly.js/dist/plotly.js":"https://ga.jspm.io/npm:plotly.js@2.7.0/dist/plotly.js"},"x":1030,"y":280,"wires":[["809cfcb5c0b64c91","b222d159488d5db8"]]},{"id":"da66d305d754fd91","type":"split","z":"bad040845be2efb7","name":"","splt":"\\n","spltType":"str","arraySplt":1,"arraySpltType":"len","stream":false,"addname":"","x":630,"y":280,"wires":[["ba05af71821ffa99"]]},{"id":"809cfcb5c0b64c91","type":"change","z":"bad040845be2efb7","name":"","rules":[{"t":"set","p":"plot_init_done","pt":"flow","to":"true","tot":"bool"},{"t":"set","p":"payload","pt":"msg","to":"measurement_data","tot":"flow"}],"action":"","property":"","from":"","to":"","reg":false,"x":535,"y":280,"wires":[["da66d305d754fd91"]],"l":false},{"id":"ba05af71821ffa99","type":"change","z":"bad040845be2efb7","name":"","rules":[{"t":"move","p":"payload","pt":"msg","to":"payload.data","tot":"msg"},{"t":"set","p":"payload.topic","pt":"msg","to":"measurement data","tot":"str"},{"t":"set","p":"payload.channel_nbr","pt":"msg","to":"parts.index","tot":"msg"}],"action":"","property":"","from":"","to":"","reg":false,"x":800,"y":280,"wires":[["9bcce05f35579a45"]]},{"id":"e4ef603517a1654a","type":"function","z":"bad040845be2efb7","name":"live data","func":"let measurement_data = flow.get(\"measurement_data\", \"default\");\n\n// check if channel was initialized (channel_nbr equals index of array element)\n/*if (msg.channel_nbr > measurement_data.length - 1) {\n\n    measurement_data.push([[], [], { name: msg.channel_name }]);\n}*/\n\n// store current measurement in memory\nmsg.timestamp = new Date().toISOString().replace(\"T\", \" \").replace(\"Z\", \"\");\n\n\nmsg.payload = Math.random()*10;\nmeasurement_data[msg.channel_nbr][0].push(msg.timestamp);\nmeasurement_data[msg.channel_nbr][1].push(msg.payload);\n\n\n\nreturn msg;","outputs":1,"noerr":0,"initialize":"","finalize":"","libs":[],"x":500,"y":420,"wires":[["f2927159ceec149d"]]},{"id":"d90d6df6f9190c92","type":"inject","z":"bad040845be2efb7","name":"live data CH1","props":[{"p":"payload"},{"p":"topic","vt":"str"},{"p":"channel_nbr","v":"1","vt":"num"}],"repeat":"","crontab":"","once":false,"onceDelay":"5","topic":"","payload":"","payloadType":"num","x":150,"y":380,"wires":[["e4ef603517a1654a"]]},{"id":"a5150785cb42641f","type":"change","z":"bad040845be2efb7","name":"prepare msg for frontend","rules":[{"t":"move","p":"payload","pt":"msg","to":"payload.value","tot":"msg"},{"t":"set","p":"payload.timestamp","pt":"msg","to":"timestamp","tot":"msg"},{"t":"set","p":"payload.channel_nbr","pt":"msg","to":"channel_nbr","tot":"msg"},{"t":"set","p":"payload.topic","pt":"msg","to":"live data","tot":"str"}],"action":"","property":"","from":"","to":"","reg":false,"x":830,"y":420,"wires":[["9bcce05f35579a45"]]},{"id":"3510082adf3fcb5b","type":"inject","z":"bad040845be2efb7","name":"live data CH2","props":[{"p":"payload"},{"p":"topic","vt":"str"},{"p":"channel_nbr","v":"2","vt":"num"}],"repeat":"","crontab":"","once":false,"onceDelay":"5","topic":"","payload":"","payloadType":"num","x":150,"y":420,"wires":[["e4ef603517a1654a"]]},{"id":"c94301117ce1bf05","type":"flexdash ctrl","z":"bad040845be2efb7","name":"","fd":"8c6540ab2d9a3573","weak_fd":"","fd_output_topic":"","x":110,"y":160,"wires":[["0477a14e03f1401d","02ef6307327ee710"]]},{"id":"0477a14e03f1401d","type":"debug","z":"bad040845be2efb7","name":"debug 99","active":true,"tosidebar":true,"console":false,"tostatus":false,"complete":"true","targetType":"full","statusVal":"","statusType":"auto","x":280,"y":200,"wires":[]},{"id":"02ef6307327ee710","type":"switch","z":"bad040845be2efb7","name":"","property":"payload.type","propertyType":"msg","rules":[{"t":"eq","v":"idle client","vt":"str"},{"t":"eq","v":"new client","vt":"str"},{"t":"eq","v":"change tab","vt":"str"}],"checkall":"true","repair":false,"outputs":3,"x":570,"y":160,"wires":[["9e1cb1232ed3889e"],["9bcce05f35579a45"],[]]},{"id":"9e1cb1232ed3889e","type":"change","z":"bad040845be2efb7","name":"close","rules":[{"t":"set","p":"plot_init_done","pt":"flow","to":"false","tot":"bool"}],"action":"","property":"","from":"","to":"","reg":false,"x":770,"y":140,"wires":[[]]},{"id":"6748e1622121e9f3","type":"inject","z":"bad040845be2efb7","name":"","props":[{"p":"payload"},{"p":"topic","vt":"str"}],"repeat":"","crontab":"","once":true,"onceDelay":0.1,"topic":"","payload":"","payloadType":"date","x":150,"y":100,"wires":[["45dc46e1fd0f3669"]]},{"id":"45dc46e1fd0f3669","type":"function","z":"bad040845be2efb7","name":"init context","func":"// todo: allow dynamic channel name configuration \n\nlet nbr_of_channels = 14 - 1; \ntmp_array = [];\nfor (let c = 0; c <= nbr_of_channels; c++) {\n    tmp_array.push([[], [], { name: \"CH\" + c }]);\n}\n\n\n\ntmp_array[0][2].name = \"Set Point\";\ntmp_array[1][2].name = \"TC1\";\ntmp_array[2][2].name = \"TC2\";\ntmp_array[3][2].name = \"TC3\";\ntmp_array[4][2].name = \"TC4\";\ntmp_array[5][2].name = \"TC5\";\ntmp_array[6][2].name = \"TC6\";\ntmp_array[7][2].name = \"TC7\";\ntmp_array[8][2].name = \"TC8\";\ntmp_array[9][2].name = \"TC9\";\ntmp_array[10][2].name = \"TC10\";\ntmp_array[11][2].name = \"TC11\";\ntmp_array[12][2].name = \"TC12\";\ntmp_array[13][2].name = \"Hidden Line\"; \ntmp_array[13][2].visible = \"legendonly\"; \ntmp_array[13][2].color = \"pink\"; \n\nflow.set(\"measurement_data\", tmp_array, \"default\");\n\nflow.set(\"plot_init_done\", false, \"default\")\n\nreturn msg;","outputs":1,"noerr":0,"initialize":"","finalize":"","libs":[],"x":330,"y":100,"wires":[[]]},{"id":"b222d159488d5db8","type":"debug","z":"bad040845be2efb7","name":"debug 101","active":true,"tosidebar":true,"console":false,"tostatus":false,"complete":"false","statusVal":"","statusType":"auto","x":1190,"y":280,"wires":[]},{"id":"d68d9f82c245a89e","type":"inject","z":"bad040845be2efb7","name":"live data CH3","props":[{"p":"payload"},{"p":"topic","vt":"str"},{"p":"channel_nbr","v":"3","vt":"num"}],"repeat":"1","crontab":"","once":false,"onceDelay":"5","topic":"","payload":"","payloadType":"num","x":160,"y":460,"wires":[["e4ef603517a1654a"]]},{"id":"f2927159ceec149d","type":"switch","z":"bad040845be2efb7","name":"","property":"plot_init_done","propertyType":"flow","rules":[{"t":"true"}],"checkall":"true","repair":false,"outputs":1,"x":650,"y":420,"wires":[["a5150785cb42641f"]]},{"id":"784bb3ac040bfd41","type":"comment","z":"bad040845be2efb7","name":"do some inits after startup / deploy","info":"","x":200,"y":60,"wires":[]},{"id":"8aa9674a8dd22f27","type":"comment","z":"bad040845be2efb7","name":"send data to the frontend / plotly","info":"CH3 sends a random value to the plot every second","x":190,"y":340,"wires":[]},{"id":"480aad50f022c835","type":"comment","z":"bad040845be2efb7","name":"handle ui events (open, close)","info":"","x":640,"y":100,"wires":[]},{"id":"74d1bafad2336a06","type":"comment","z":"bad040845be2efb7","name":"init load data from memory (context)","info":"","x":660,"y":240,"wires":[]},{"id":"a96ede31d15e8fcc","type":"flexdash container","name":"NFDC","kind":"StdGrid","fd_children":",7d8110bad209c9b4,e7c4f917522b9e07,73d471ead270d371,21933cee466bf173,9bcce05f35579a45,a2422671d593b0ee,585ad6165adfc57b,862ff94b5a829c55","title":"NFDC","tab":"1e908252f3517797","min_cols":"6","max_cols":"20","unicast":"ignore","parent":"","solid":false,"cols":"1","rows":"1"},{"id":"1e908252f3517797","type":"flexdash tab","name":"","icon":"mdi-view-dashboard","title":"plotly tab","fd_children":",a96ede31d15e8fcc","fd":"8c6540ab2d9a3573"}]

@tve this is more of a general question regarding FD ctrl: are you planning to implement a close event?

2 Likes

Cool stuff!! looks complicated, though....

You're actually re-implementing a lot of what FlexDash already does. FlexDash caches the state, you don't need to deal with connecting and disconnecting browsers. Right now you have to duplicate just a little bit of work 'cause you can't manipulate the cached state directly in a custom widget.

Here's a flow that demos incremental additions to the plot. Initially a plot with 10 points is inserted, then every second one data point is added. You can inject a clear (or a reset to the 10pts) at any time. The accumulate node is relatively simple and accumulates up to 20 points. This is supposed to be done in the cached FlexDash state but due to the above limitation I'm doing it externally, so it's not as efficient. To be fixed...

You can connect with a 2nd browser and refresh at will, you will always see the same plot everywhere. No need to use the FD ctrl node, no need to track browsers.

[{"id":"e9b320e81e2e1981","type":"flexdash custom","z":"3b73bf0142d0cbcc","fd_container":"a96ede31d15e8fcc","fd_cols":"5","fd_rows":"5","fd_array":false,"fd_array_max":10,"fd_output_topic":"","fd_loopback":false,"name":"Plotly Row-Wise","title":"Plotly ESM","sfc_source":"<template>\n  <div class=\"w-100 h-100\" ref=\"plotly\">\n  </div>\n</template>\n\n<script>\n  import Plotly from \"plotly.js/dist/plotly.js\"\n\nexport default {  \n  props: {\n    payload: { default: null, type: Array },\n    options: { default: {}, type: Object }\n  },\n\n  data() { return {\n    plot: null,\n  }},\n\n  computed: {\n    columnar() {\n      if (!this.payload || !Array.isArray(this.payload)) return null\n      return this.transpose(this.payload)\n    }\n  },\n\n  // mounted happens after props and data are init'd\n  mounted() { this.create_plot() },\n\n  watch: {\n    payload(v) { this.create_plot() },\n    options(v) { this.create_plot() },\n  },\n\n  methods: {\n    create_plot() {\n      if (this.plot) console.log(\"PLOT:\", Object.keys(this.plot))\n      if (!this.columnar) return\n      const data = [{\n        'x': this.columnar[0],\n        'y': this.columnar[1],\n      }]\n      this.plot = Plotly.newPlot(this.$refs.plotly, data, this.options, {\n        displaylogo: false, displayModeBar: true, scrollZoom: true, autosize: true\n      })\n      console.log(\"PLOT:\", Object.keys(this.plot))\n    },\n\n    // transpose from row format coming in to column format required by plotly\n    transpose(data) {\n      if (!data || data.length == 0) return []\n      if (!data[0].map) {\n        console.log(\"Plotly: cannot transpose\", data)\n        return []\n      }\n      let tr = data[0].map(() => Array(data.length))\n      data.forEach((d, i) => {\n        d.forEach((v, j) => {\n          tr[j][i] = v\n        })\n      })\n      return tr\n    },\n  },\n  \n}\n</script>","import_map":{"plotly.js/dist/plotly.js":"https://ga.jspm.io/npm:plotly.js@2.7.0/dist/plotly.js"},"x":640,"y":580,"wires":[[]]},{"id":"452aa0431a6dfe4c","type":"function","z":"3b73bf0142d0cbcc","name":"accumulate","func":"let pl = msg.payload\nif (pl) {\n    // got some data, see whether it's a full data set or incremental\n    if (!Array.isArray(pl)) pl = [Date.now(), pl] // allow adding a single value to a single series\n    else if (Array.isArray(pl[0]) || pl.length == 0) {\n        // got 2D array, i.e. full dataset; save it and forward it\n        context.set(\"data\", pl)\n        return msg\n    }\n    // we got just a row, append to saved data\n    const cache = context.get(\"data\") || []\n    if (cache.length > 0 && pl.length != cache[0].length) {\n        node.error(`msg.payload has ${pl.length} data series while accumultaed data has ${cache[0].length}`)\n        return\n    }\n    cache.push(pl)\n    // remove excess old values\n    while (cache.length > 20) cache.shift()\n    context.set(\"data\", cache)\n    msg.payload = cache\n}\n\nreturn msg","outputs":1,"noerr":0,"initialize":"","finalize":"","libs":[],"x":450,"y":580,"wires":[["e9b320e81e2e1981"]]},{"id":"f24d68d730b6197e","type":"inject","z":"3b73bf0142d0cbcc","name":"add one","props":[{"p":"payload"},{"p":"topic","vt":"str"}],"repeat":"1","crontab":"","once":true,"onceDelay":"3","topic":"","payload":"","payloadType":"date","x":100,"y":540,"wires":[["3958e9f3df73c8da"]]},{"id":"3958e9f3df73c8da","type":"function","z":"3b73bf0142d0cbcc","name":"gen waves","func":"return { payload: 8* Math.sin(Date.now() / 10000) }","outputs":1,"noerr":0,"initialize":"","finalize":"","libs":[],"x":270,"y":540,"wires":[["452aa0431a6dfe4c"]]},{"id":"6c1a699b0d8a3960","type":"inject","z":"3b73bf0142d0cbcc","name":"clear","props":[{"p":"payload"},{"p":"options","v":"{\"title\":\"\",\"xaxis\":{\"type\":\"date\"}}","vt":"json"}],"repeat":"","crontab":"","once":false,"onceDelay":0.1,"topic":"","payload":"[]","payloadType":"json","x":90,"y":580,"wires":[["452aa0431a6dfe4c"]]},{"id":"7fba843c73b975b7","type":"inject","z":"3b73bf0142d0cbcc","name":"10pts","props":[{"p":"payload"}],"repeat":"","crontab":"","once":true,"onceDelay":0.1,"topic":"","payload":"","payloadType":"date","x":90,"y":620,"wires":[["e9537c6ad11cfea1"]]},{"id":"e9537c6ad11cfea1","type":"function","z":"3b73bf0142d0cbcc","name":"gen 10","func":"msg.payload = Array(10).fill(0).map((v,ix) => [\n    (Date.now()) - ix*1000,\n    ix&1 ? 0 : ix\n]).reverse()\nreturn msg","outputs":1,"noerr":0,"initialize":"","finalize":"","libs":[],"x":250,"y":620,"wires":[["452aa0431a6dfe4c"]]},{"id":"a96ede31d15e8fcc","type":"flexdash container","name":"NFDC","kind":"StdGrid","fd_children":",7d8110bad209c9b4,e7c4f917522b9e07,73d471ead270d371,0ca10a099f0a6969,1d8ee88fedb20405,e0dc4b448dc085ca,78673e91a6b52f72,e3983cea6d9d4c2c,e9b320e81e2e1981","title":"NFDC","tab":"1e908252f3517797","min_cols":"6","max_cols":"20","unicast":"ignore","parent":"","solid":false,"cols":"1","rows":"1"},{"id":"1e908252f3517797","type":"flexdash tab","name":"Repros","icon":"mdi-view-dashboard","title":"Repro","fd_children":",a96ede31d15e8fcc","fd":"e8f5aea52ab49500"}]

I'll try to write something about about the state mirroring (as opposed to sending messages)...

Update: Mirror state -- don't send messages - FlexDash

1 Like