FlexDash is an IoT dashboard built using modern web components and with deep integration into Node-RED. It is very similar in general concept to the standard Node-RED dashboard: it has tabs filled with a grid of widgets, each of which displays data fed through some node in a Node-RED flow. E.g.:
any property of any widget can be changed dynamically, e.g. title, colors, size, data, etc.
it supports dynamic arrays of widgets, i.e., the number and contents of widgets is controlled dynamically using Node-RED messages
it supports Node-RED subflows, i.e., a panel with widgets can be placed into a subflow and each instance of that subflow produces a copy of that panel and widgets (with some limitations...)
it is optimized for both desktop and mobile browser support
it can embed tabs of the std Node-RED dashboard seamlessly thereby enabling tab-by-tab migration
it uses Vue 3, which is one of the most popular and easy to learn web frameworks, making customization as easy as possible
it has deep integration into Node-RED very similar to the std dashboard
it uses the same chart library as Grafana (called uPlot), which is a very flexible and super fast charting library
it comes with a decent set of widgets to display data and to let users initiate actions (buttons, toggles, etc.)
it supports developing custom widgets with hot-module-reload of the widget
it's all open source, no strings attached
About the making of FlexDash... I've been wanting something more modern, responsive, and much better performing than the std Node-RED dashboard for years. About a year and a half ago I had a month of "forced computer time without work" due to surgery and decided to see what happens if I put something together.
The first version of FlexDash did not have any real integration into Node-RED but it worked. It is now in active use in a project for field-deployed Raspberry Pis that detect and record radio-tagged birds as they migrate around the globe. Along the way the feedback I gathered from the Node-RED community is that a Node-RED dashboard must come with a set of NR nodes that represent the widgets of the dashboard while at the time FlexDash used a more powerful but evidently less intuitive paradigm. I eventually decided to try my hand at writing a Node-RED integration that makes FlexDash work pretty much like the std NR dashboard. Little did I know... I'm pretty sure I've now spent more time on that integration than on FlexDash itself... But here it is in alpha form.
This first alpha release comes with many caveats. The first two are:
it probably won't work for you
it has more unknown issues than known ones, and there's a long list of known ones
But more seriously, the core functionality of FlexDash itself has been quite stable so far but the integration into Node-RED makes me nervous because it makes pretty deep assumptions about how NR works. And "NR" really refers to two distinct software packages: the Node-RED server and the dashboard, each of which is many multiples the size of all of FlexDash.
This is perhaps a good place to mention that FlexDash has documentation! It's of course alpha-ware but it has a list of limitations and known issues, information on how to get started, and how to load the example flows that show off all the existing widgets. The widgets themselves all have the standard Node-RED type of help info (shown in the side-bar of the NR flow editor) and all properties that can be set on widgets have short help text in the edit forms in the flow editor.
I'm currently in the midst of migrating my own home-automation dashboard to FlexDash. I have a couple of tabs converted and the rest are simply embedded from the std dashboard. I fully expect to trip up and hit bugs and missing features, but I thought I might as well release earlier rather than later to gather feedback.
if you need help implementing something with FlexDash, e.g., "how do I put two buttons under a table", please start your own thread and mention me, i.e., @tve
if you are hitting a bug or something that doesn't seem to work right, please post at the end of this thread, preferably with a screen shot, a flow, and as much info as you can put together.
Hi @craigcurtin,
Thanks for your offer to experiment with FlexDash!!
During the last months I had quite a lot of chitchats with Thorsten behind the scenes, and the amount of time he has been spending to deliver us a new dashboard (for free) is very impressive. So I really hope some folks of the community can help Thorsten by testing Flexdash, and to give "constructive" feedback.
It doesn't happen very frequently that such talented developers pass by to help this community for free, so it might be a good plan to keep him a bit motivated
Bart
NOTE: it looks like any widget with the expand arrows hit the same situation. When the browser (Safari, FireFox, and Chrome - all on a mac) window grows beyond a certain size, the arrows vanish from the upper right of that widget window. Shrink the browser window and they return.
I will start trying this out in my test environment. But can I ask that you consider creating a github repository so there is a better way to communicate issues and requests? I am afraid that having them all in this single thread will get confusing and they will get lost.
As you noticed everything is on github, e.g., FlexDash · GitHub
The reason I didn't mention that is that there are 3 repos involved and I'm not sure how to manage the issues yet, so I'd rather see a message here and then take it to an issue where appropriate.
Thanks for the problem description! When I try it, it works, unless the grid is scaled up. If you look in the bottom-right corner of the grid there should be a little "grid scale 1.2x" or similar text rotated 90 degrees. When it doesn't show or is close to 1.0x you should see the collapse icon. Change the size of your browser window to change the scaling. Obviously this is a bug, I'm just trying to confirm that there's not some additional issue.
I wonder if what is happening is that as the frame is expanded, the left side and bottom leaves the viewing area. As I make it bigger, both the bottom and left disappear. You can no longer see the times (hours) that the bottom. here are two browsers shoing the difference:
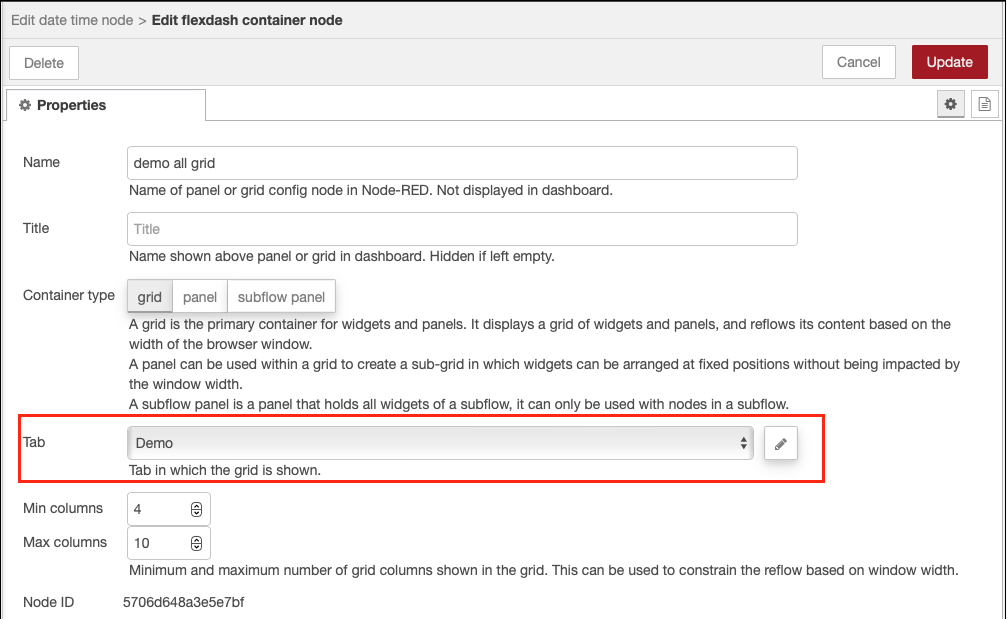
My bad, I didn't update that part of the docs when I made a last minute change with import/export. The export has a trick such that if you select a bunch of nodes and export them, which is what I did for all but the hello world example, the dashboard config node doesn't get exported. This means that on import, the imported nodes are not connected to a dashboard, specifically, the tab(s) is not connected to one. Importing a dashboard is generally a mess (and security issue) because it likely collides with an existing dashboard and adding a new one is very rarely what a user wants when importing some example.
There are three options I'm considering:
leave as-is requiring the user to fix the tab(s), OK for alpha but not great...
automatically connect the tab to an existing dashboard if there is only one (leave for manual fixing otherwise)
figure out something better for all this (I believe the std dashboard has quite a pile of tricky code to deal with import and duplicate/missing config nodes)
Demo problem, my bad. The toggle always only shows its input value, so for a click to cause it to actually toggle visually, its output needs to be connected to its input. The demo didn't do that. Fixed for the next update.
(I know that the semantics of toggle has been hotly debated in the past and that this implementation is different from the one in the std dashboard...)
Uhhh, definitely an issue! You ended up with two definitions for the "toggle" node type and the flexdash one won. Looks like I better rename all the FD core widgets to have an fd_ prefix. This will break all the examples and flows I have... But better now than later.
Yup, it's related to the scaling. I need to do the full-page pop-up properly and move the widget into a proper overlay. This will also fix an issue with the magnification extending to the bottom of the grid and not the page.
1 Aug 18:58:50 - [info] Node-RED FlexDash plugin version 0.4.67
1 Aug 18:58:51 - [info] Node-RED FlexDash version 0.4.67
1 Aug 18:58:51 - [info] Node-RED FD Core Widgets version 0.4.29
1 Aug 18:58:51 - [info] FlexDash UI version 0.4.33
This fixes:
node type name collisions, e.g. 'toggle' (it's now 'fd-toggle')
importing example flows no longer requires attaching tab to dashboard (only fixed example flows, didn't implement auto-connecting tab to one existing dashboard)
fixes non-working toggle in all-widgets example
Still open:
maximizing a widget results in off-screen stuff when grid is being scaled up
importing the time-wind-plot example creates unusable tab in dashboard: requires browser reload
This update breaks existing flows with FlexDash widgets!
Due to the change in the core widget type names (first issue fixed above). My apologies.
This looks like it was a huge undertaking... Thank you for sharing it all with us.
I'm going to run it thorough it's paces by making a copy of my Sonoran Desert Fish Nook project and replace the Angular based included dashboard with your Flex Dash Vue 3.0 based dashboard. I have some extensive travel coming up, but I'll get to it in a few weeks....
I did receive an error when attemptinng to install node-red-fd-testnodes. I installed FLexDash first... restarted node red... installed the corewidgets... restarted node red.... attempted the testnodes install (from palette manager as well) and I flashed a Failed to Install Error... This is what the log has:
2022-08-02T03:43:00.740Z Install : @flexdash/node-red-fd-testnodes 0.0.6
2022-08-02T03:43:00.837Z npm install --no-audit --no-update-notifier --no-fund --save --save-prefix=~ --production --engine-strict @flexdash/node-red-fd-testnodes@0.0.6
2022-08-02T03:43:01.850Z [err] npm
2022-08-02T03:43:01.851Z [err] WARN
2022-08-02T03:43:01.851Z [err] config production Use --omit=dev instead.
2022-08-02T03:43:05.134Z [out]
2022-08-02T03:43:05.134Z [out] up to date in 3s
2022-08-02T03:43:05.170Z rc=0
I also appear to have similar messages for the corewidgets, but pallette manager didn't report any install failures there.
1 Aug 21:37:12 - [info] Node-RED FlexDash plugin version 0.4.68
1 Aug 21:37:13 - [info] Node-RED FlexDash version 0.4.68
1 Aug 21:37:13 - [info] Node-RED FD Core Widgets version 0.4.30
1 Aug 21:37:15 - [info] FlexDash UI version 0.4.34
Fixes:
correctly maximizes widgets when grid is scaled
fixes errors when using array widgets due to using the widget ID in selectors
I have not updated that repo in a while, it's stale. Is there anything in the docs that suggests installing it? I'm focusing on the built-in widgets and corresponding nodes in node-red-fd-corewidgets at the moment.
2022-08-02T03:41:56.362Z [err] WARN
2022-08-02T03:41:56.362Z [err] config production Use --omit=dev instead.
How are you installing these packages? You have a --production flag in the commandline that is deprecated. But it doesn't do any harm either.